Polygon (MATIC/USD) Market Retraces Against $1.20
Estimated Reading Time: 3 minutes
Don’t invest unless you’re prepared to lose all the money you invest. This is a high-risk investment and you are unlikely to be protected if something goes wrong. Take 2 minutes to learn more
Polygon Price Prediction – November 6
Recently, an explosive motion took effect in the MATIC/USD trade, breaking forcefully through several resistances up to the high point of around $1.30 and now leading to a contrary direction that makes the crypto market retraces against the $1.20 trading line. The crypto economy is experiencing a negative drawdown rate of 2.62%, trading around $1.154 points as of the time of writing.
MATIC/USD Market
Key Levels
Resistance levels: $1.25, $1.30, $1.35
Support levels: $1.05, $1, $0.95
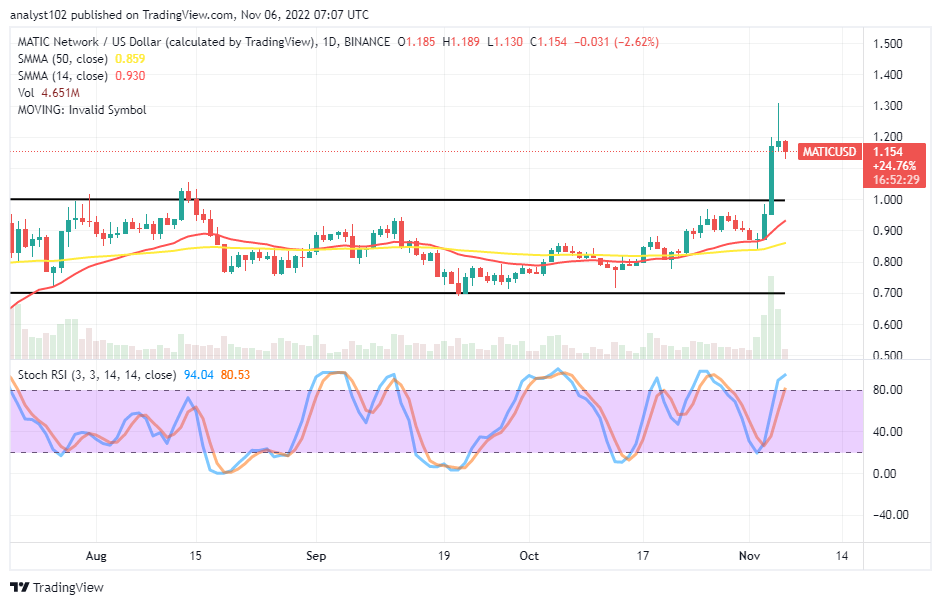
MATIC/USD – Daily Chart
The MATIC/USD daily chart showcases the crypto market retraces against the $1.20 trading line after making ups to touch a resistance point around the $1.30 during the active upward gravitational forces. The 14-day SMA indicator is at $0.93 above the $0.859 value point of the 50-day SMA indicator. And they are within the range-bound spots of the upper and the lower horizontal lines drawn. The Stochastic oscillators are keeping range values of 80.53 and 94.04 in the overbought region with an attempt to curve the blue line to the southbound. That signifies there may soon be weaknesses in the upward direction.
Are there signs that the MATIC/USD market will go into a depression soon?
As the MATIC/USD market operation retraces against the $1.20 trading line, it shows the crypto economy will likely succumb to a declining motion soon below the $1.30 resistance level. If the recent upsurge must hold over time, the market will tend to maintain a new bullish-trading arena, as shown by the horizontal line created at the $1 level with a closure-supporting point at the $0.95 line. Therefore, buyers need to pay attention to those points afterward to get back a rebuying signal order.
On the downside of the technical analysis, the MATIC/USD market bears will have to safeguard their entrees between the resistances of $1.35 and $1.40 in the event of having other rounds of unprecedented northward surges from the point of $1.20 trading zone. As it is currently, sellers may be having it their turn to find an ideal positional entry when a correction motion will get intensive.

MATIC/BTC Price Analysis
In comparison, Polygon has pushed extensively against the trending weight of Bitcoin to a certain peak over the trend lines of the SMAs. Presently, the cryptocurrency pair trade retraces against some high-trading points it breached past to the upside in the recent time operations. The 14-day SMA indicator is trending northwardly at a close spot over the 50-day SMA indicator, which is also facing the same direction. The Stochastic Oscillators are in the overbought region, keeping range values of 84.66 and 95.09. that shows the velocity between the base and the counter cryptos to the upside is facing a reduction gradually.
Note: Cryptosignals.org is not a financial advisor. Do your research before investing your funds in any financial asset or presented product or event. We are not responsible for your investing results.
You can purchase Lucky Block here. Buy LBLOCK