Polygon (MATIC/USD) Price Is Making a Baseline Below the SMAs
Estimated Reading Time: 3 minutes
Don’t invest unless you’re prepared to lose all the money you invest. This is a high-risk investment and you are unlikely to be protected if something goes wrong. Take 2 minutes to learn more

Free Crypto Signals Channel
Polygon Price Prediction – September 18
Frantic efforts are ongoing in the MATIC/USD market operation as the crypto market is making a baseline for possible upward motions below the SMAs. The whole trading indicators’ outlook portends a minute negative percentage rate of 0.60 as the price trades around $0.823 at the time of writing.
MATIC/USD Market
Key Levels
Resistance levels: $1, $1.15, $1.30
Support levels: $0.70, $0.60, $0.50
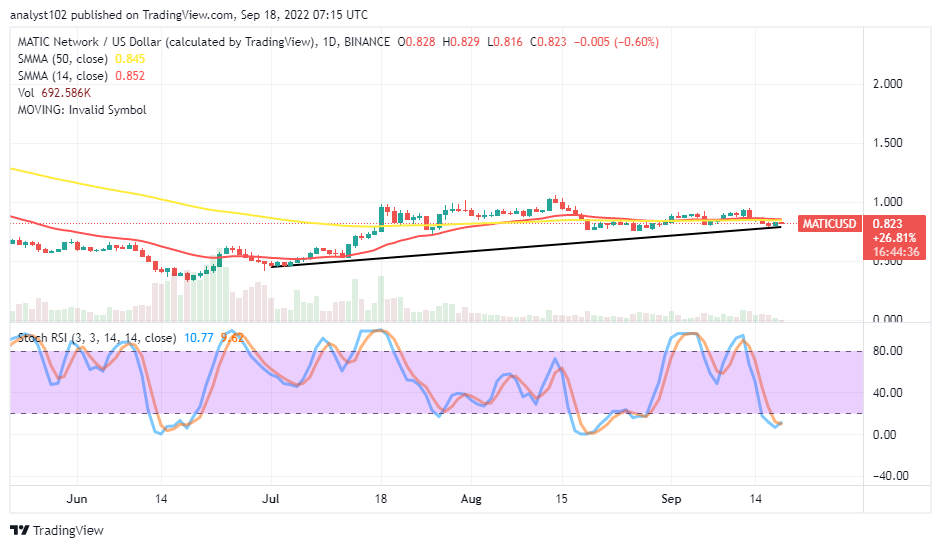
MATIC/USD – Daily Chart
The MATIC/USD daily chart showcases the crypto market is making a baseline below the SMAs’ sell signal side at a closure spot. There has been a tight space between the indicators’ trend lines. The 14-day SMA is at $0.852, while the 50-day SMA is at $0.845 underneath it. The bullish trend line remains drawn underneath the trend lines of the SMAs to touch a logical support point. The Stochastic Oscillators have dipped into the oversold region to keep10.77 and 9.62 range values.
Will there be more falls below the SMA trend lines from the MATIC/USD market’s current trading point?
Indications have denoted that not much will be, talking about seeing the MATIC/USD market operation falling further below the SMA trend lines from its current trading point as the price has been making a baseline below the SMAs. Buying activities may have to play out decently through the use of 1-hour and 4-hour time frames in complementing each position’s execution techniques. In the face of that sentiment forthcoming up timely, the $0.70 support level must not breach to the south side to keep for a long time underneath it afterward.
On the downside of the technical analysis, selling forces to the downside in this crypto market are less running into exhaustion below the trading SMA indicators as indicated by the Stochastic Oscillators. It would be hard to fearfully push the MATIC/USD trade line through some lower support levels from its present trading zone. A sudden forceful pull-down below the SMAs may lead to the chance of letting in a bounce-off in no time.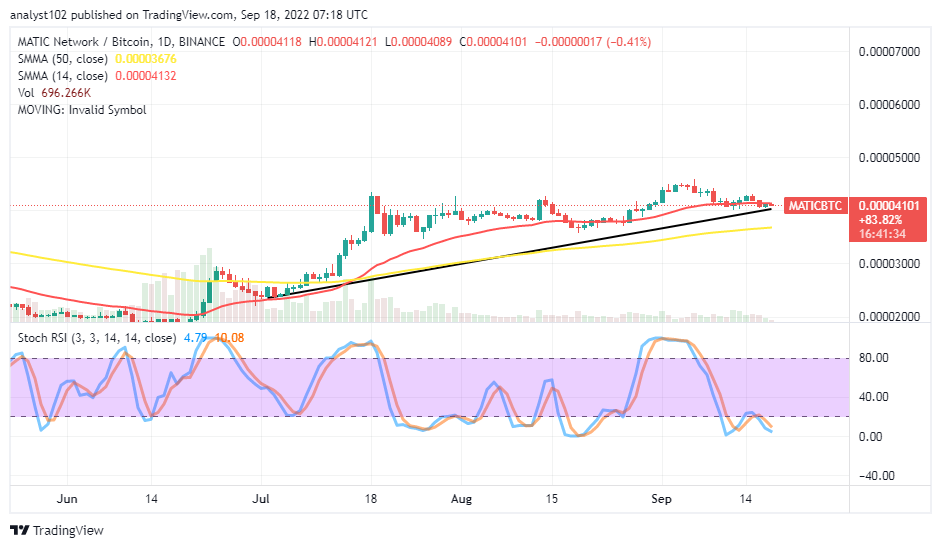
MATIC/BTC Price Analysis
The trending outlook between Polygon and Bitcoin still looks relatively bullish. Also, there is a line of ranging motions at a high-trading zone around the trend line of the smaller SMA. The 50-day SMA indicator is underneath the 14-day SMA indicator. The bullish trend line drew from a lower point to a higher point, below the smaller-trading indicator. The Stochastic Oscillators are in the oversold region. And they are at 10.08 and 4.79 range lines. That signifies the base crypto is gradually heading toward a point of building a baseline to swing high against its counter-trading crypto in the near time.
Note: Cryptosignals.org is not a financial advisor. Do your research before investing your funds in any financial asset or presented product or event. We are not responsible for your investing results.
You can purchase Lucky Block here. Buy LBLOCK