Polygon (MATIC/USD) Trade Forms Bottoms, Attempting to Rise
Estimated Reading Time: 3 minutes
Don’t invest unless you’re prepared to lose all the money you invest. This is a high-risk investment and you are unlikely to be protected if something goes wrong. Take 2 minutes to learn more

Polygon Price Prediction – August 20
The MATIC/USD market forms bottoms, attempting to rise from the recent extension of retracement movements, initially spanning from a high point of around $0.90 to relatively complete trading slightly below the lower-trading line of $0.60.
Technically, additional downward pressure may be required to extend the trend toward $0.50 without any convincing signs of a good place to begin a short position. Therefore, the energizing moments for the enjoyment of ideal values must occur during future trade scenarios. Given that supposition, bulls must exert greater force in order to shift the trend back in the upward direction.
MATIC/USD Market
Key Levels:
Resistance levels: $0.70, $0.75, $0.80
Support levels: $0.50, $0.45, $0.40
MATIC/USD – Daily Chart
The MATIC/USD daily chart reveals that the crypto-economic trade forms bottoms, attempting to rise from below the $0.60 point.
The 14-day SMA trend line is at $0.658 beneath the $0.748 point of the 50-day SMA trend line. The stochastic oscillators have dipped into the oversold region and now point slightly northbound from 6.02 to 8.72. It appears that a rising cycle is in the pipeline. A bullish candlestick needed to form across the horizontal line drawn at $0.60 to get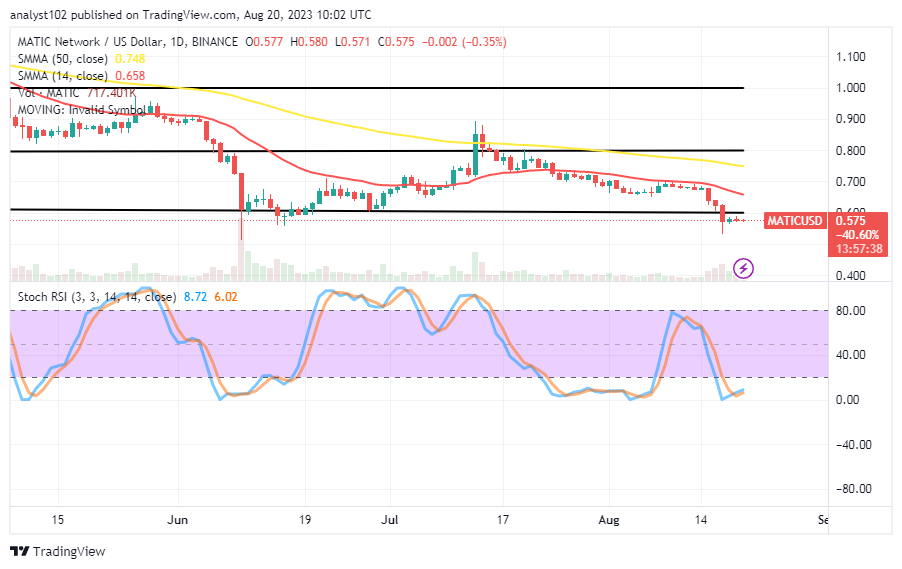
Should MATIC/USD price traders look beyond the $0.50 support level from their current position?
Going by the reading of the stochastic oscillators at this time concerning the market level of Polygon versus the US Dollar, it is not recommended to go more lowering between the points of $0.060 and $0.50 as we are presently having it that the crypto trade forms bottoms, attempting to rise possibly in the near future.
For longer breaths to be taken by long-position placers, it is psychologically best to start launching purchasing orders and to keep a stop-loss order closely around the point of $0.40 at this time. However, traders with huge amounts of equity should relinquish a buy order if the price tends to go down as low as that point of the stop-loss order.
The likelihood of bears continuously sinking further from the $0.60 line has lost a great deal of confidence. According to that assumption, sellers could have to wait for a series of pullbacks to intentionally occur in order to test the 14-day moving average or a point below the larger moving average, carrying an active reversal moving mode, to make a shorting entry. 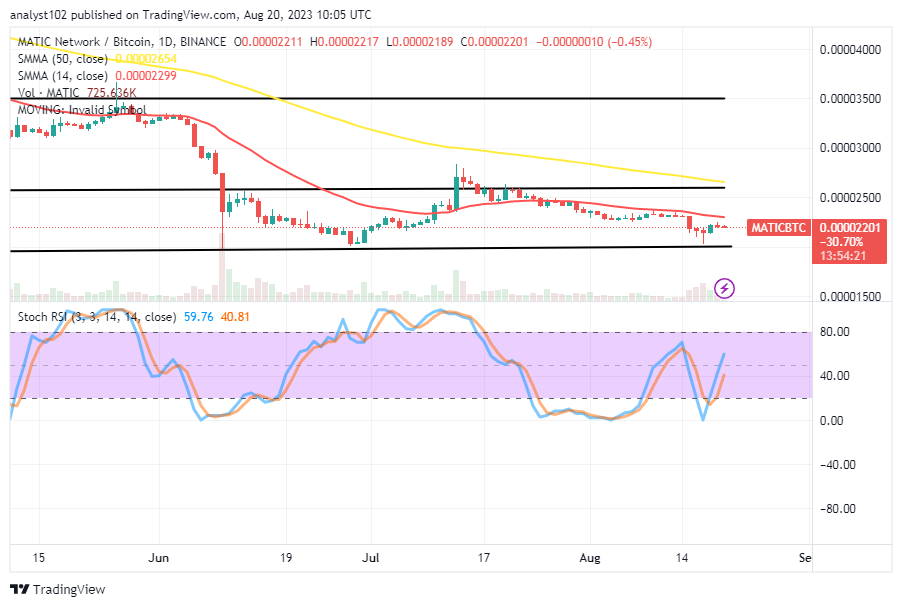
MATIC/BTC Price Analysis
In comparison, Polygon’s price has been attempting to rise against the pushing weight of Bitcoin after it forms bottoms around the horizontal line drawn below the moving averages.
Underneath the 50-day SMA indication is the 14-day SMA indicator. They continue to bend more sharply southward. The stochastic oscillators have veered away from the oversold area and are now situated between 40.81 and 59.76. A smaller bearish candlestick appears to signal a slight correction in the interim. And it can result in a further halt to more uptrends against the counter-trading instrument.
Note: Cryptosignals.org is not a financial advisor. Do your research before investing your funds in any financial asset or presented product or event. We are not responsible for your investing results.
You can purchase Lucky Block here. Buy LBLOCK