Polygon (MATIC/USD) Trade is Feebly Retracing
Estimated Reading Time: 3 minutes
Don’t invest unless you’re prepared to lose all the money you invest. This is a high-risk investment and you are unlikely to be protected if something goes wrong. Take 2 minutes to learn more
Polygon Price Prediction – October 23
The recent rallying motion in the MATIC/USD market operations has reduced as the crypto trade is feebly retracing near the $0.80 trading line. Price is decelerating at an average minute percentage rate of 0.48%, around the $0.828 point as of the time of writing.
MATIC/USD Market
Key Levels
Resistance levels: $0.90, $0.95, $1
Support levels: $0.70, $0.65, $0.60
MATIC/USD – Daily Chart
The MATIC/USD daily chart reveals the crypto trade is feebly retracing toward a lower-trading spot around the positions of the SMA trend lines. The 14-day SMA indicator is at $0.814, underneath the $0.820 value line of the 50-day SMA indicator. The range-bound zones remained characterized by three layers between $1 and $0.70 trading points. The Stochastic Oscillators have crossed southbound initially to average the 40 range. But, they are now attempting to close back northbound at 51.00 and 52.84 range values.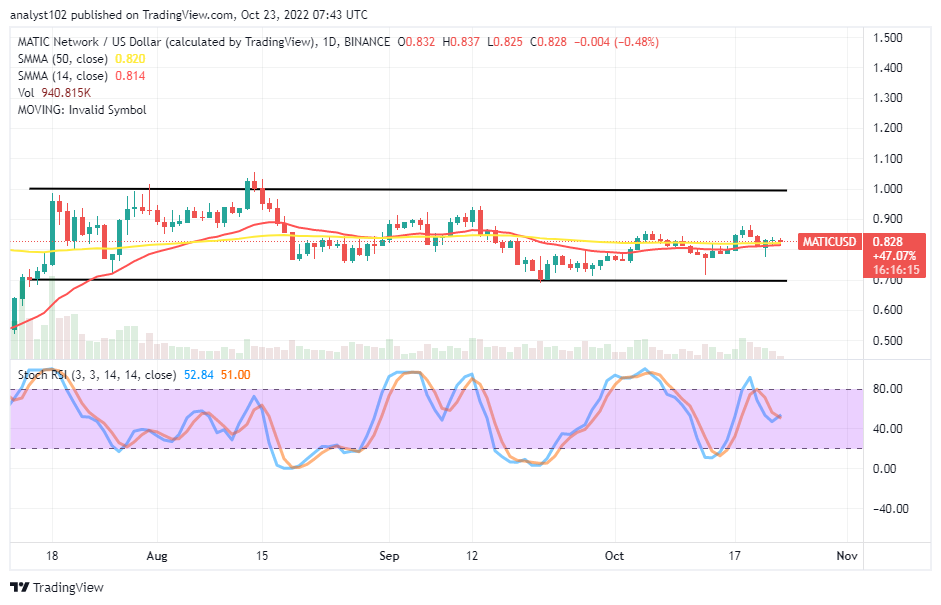
What is the current price response in the MATIC/USD market activities?
There has been a lower degree of responsiveness in the MATIC/USD market operations as the crypto trade is feebly retracing below the $0.90 resistance level. Order placement should stop at this point since the market’s trending capacity forecast is less alluring to the key movers. Pull-downs tempted to occur around the $0.80 may in no time given back stances to allow buyers to leverage on provided they spot at an early stage.
On the downside of the technical analysis, the MATIC/USD market sellers need to take cognizance of the position signal of the Stochastic Oscillators in the high-featuring region point before considering a re-launch of the selling order suggesting a resumption signal to the downside. The key resistance trading line following the present moment is at $0.90. Short-position placers may deem it technically fit by opening a pending command around the value resistance.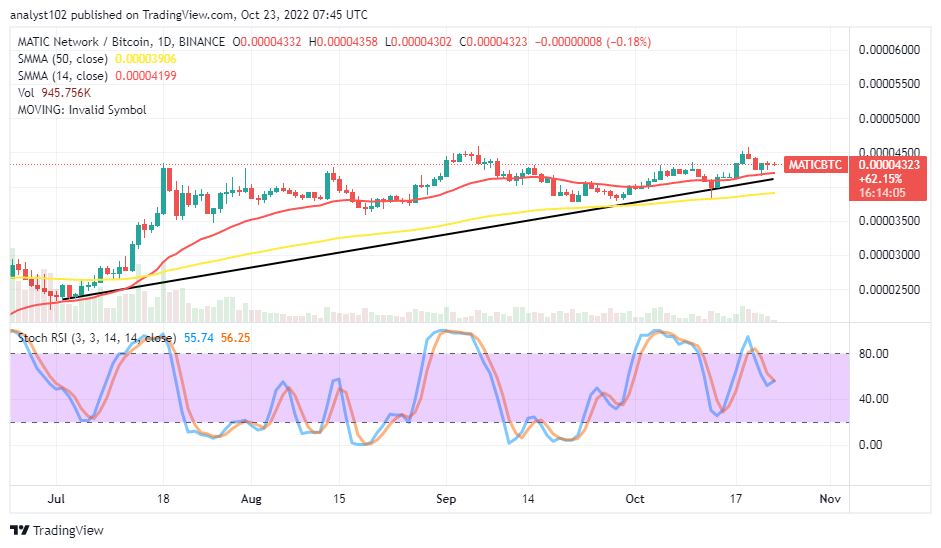
MATIC/BTC Price Analysis
In comparison, the yet-trending motion outlook between Polygon and Bitcoin shows the former trading instrument is maintaining a stronger stance against the latter. The positioning of the SMA trend lines is more trending northward in nature than in any other direction. The 50-day SMA indicator is underneath the 14-day SMA indicator. The Stochastic Oscillators have closed their lines at 56.25 and 55.74 range values. It indicates that given the pairing crypto trade may experience a pit stop soon.
Note: Cryptosignals.org is not a financial advisor. Do your research before investing your funds in any financial asset or presented product or event. We are not responsible for your investing results.
You can purchase Lucky Block here. Buy LBLOCK