Polygon (MATIC/USD) Value Retraces Below $0.90 on the Market
Estimated Reading Time: 3 minutes
Don’t invest unless you’re prepared to lose all the money you invest. This is a high-risk investment and you are unlikely to be protected if something goes wrong. Take 2 minutes to learn more

Free Crypto Signals Channel
Polygon Price Prediction – October 9
As the crypto market retraces valuation below the 40.90 resistance line, the bull market in the MATIC/USD operations has peaked without pushing substantially higher. As of the time of writing, indications indicate a positive 1.11 percent of trading near the $0.823 market line.
MATIC/USD Market
Key Levels
Resistance levels: $0.90, $0.95, $1
Support levels: $0.70, $0.65, $0.60
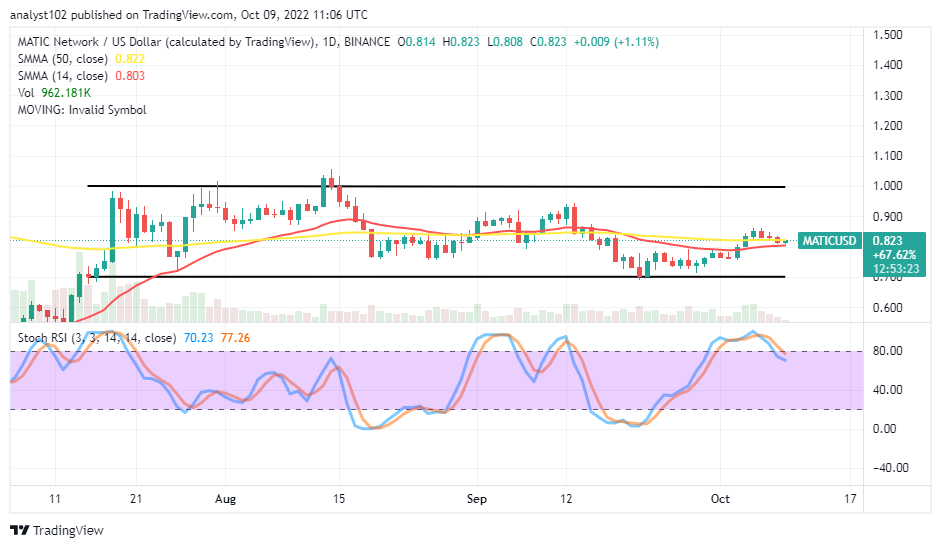
MATIC/USD – Daily Chart
The MATIC/USD value retraces below the market’s $0.90 resistance level, as seen on the daily chart. The range-bound channel trend lines are psychologically drawn at higher-trading spots to embody the paces of ups and downs the trade has been keeping over time. The 14-day SMA indicator is at $0.803, underneath the $0.822 value point of the 50-day SMA indicator. The Stochastic Oscillators have crossed southbound from the overbought region to the positions of 77.26 and 70.23 range lines, denoting that a falling force is in place currently.
Will the MATIC/USD market experience further declines as the price retraces?
Suppose the price breaks southward through the 14-day SMA’s value line as the value of the cryptocurrency market retraces below the $0.90 resistance trading level. In that case, the MATIC/USD market may likely witness additional variations of lesser sell-offs. Continue to be cautious when initiating positions that have the potential to surpass your trading money quickly. Before placing a buying order, repositioning the Stochastic Oscillators around lower range points will provide a complementary hedge opportunity.
On the negative side of the technical analysis, bears in the MATIC/USD market may maintain a firm stance against bulls’ efforts to break through the $0.90 resistance level for some time. Sellers may need to wait for the price to reject around the value line before placing a selling order, which must be by the principle of proper money management to avoid an unprecedented breakout in the trading arena.
MATIC/BTC Price Analysis
Polygon has consistently maintained a higher-pushing outlook against Bitcoin on a low-active pace to the north over a long-term running pattern. The 14-day SMA indicator has been trending upward around the trading candlesticks above the 50-day SMA indicator. The Stochastic Oscillators have crossed southbound in the overbought region, maintaining range values of 90.41 and 88.52, indicating the possibility of the base cryptocurrency succumbing to a decrease-moving mode, pairing with its counter-trading crypto.At the moment, a false active pull-up price action could trigger a decent sell entry over the trend lines of the SMAs.
Note: Cryptosignals.org is not a financial advisor. Do your research before investing your funds in any financial asset or presented product or event. We are not responsible for your investing results.
You can purchase Lucky Block here. Buy LBLOCK