Quant Price Prediction: QNT/USD Aims Fresh Rally to $120 Resistance Level
Estimated Reading Time: 2 minutes
Don’t invest unless you’re prepared to lose all the money you invest. This is a high-risk investment and you are unlikely to be protected if something goes wrong. Take 2 minutes to learn more
Quant Price Prediction – December 27
The Quant price prediction shows that QNT will cross above the upper boundary of the channel for the confirmation of the bullish movement.
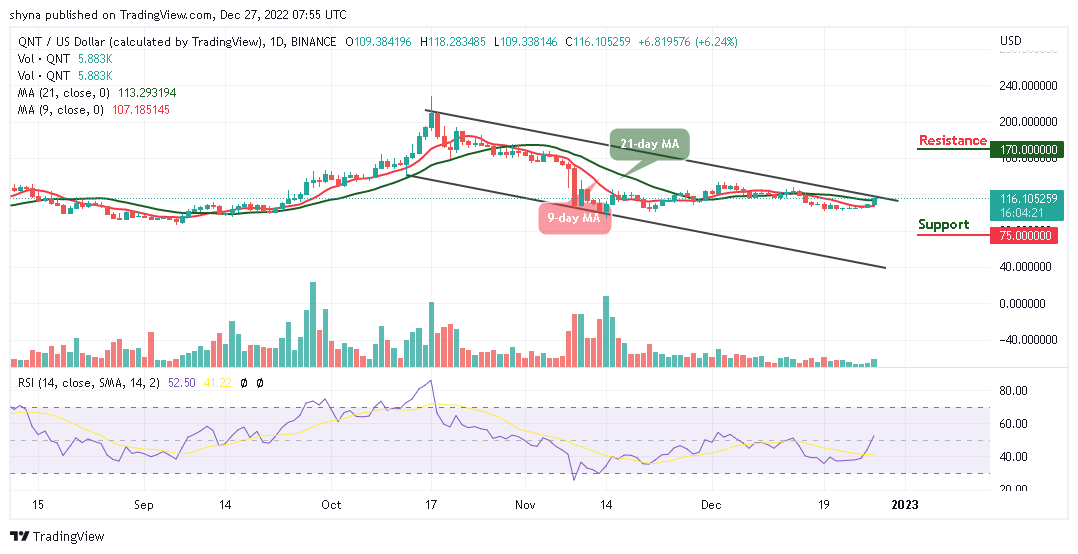
QNT/USD Medium-term Trend: Bearish (1D Chart)
Key Levels:
Resistance levels: $170, $180, $190
Support levels: $75, $65, $55
QNT/USD is hovering above the 9-day and 21-day moving averages as the coin moves to cross above the upper boundary of the channel. Looking at the daily chart, the Quant price faces the upside as traders anticipate the current price movement indicating the upcoming price rally in the market.
Quant Price Prediction: QNT/USD Heads to the North
As soon as the Quant price crosses above the upper boundary of the channel, the coin will claim the resistance level of $120 to face the potential resistance levels of $170, $180, and $190. Meanwhile, as the technical indicator Relative Strength Index (14) crosses above the 50-level, the coin may continue to gain more upsides. On the contrary, if the bulls failed to push the Quant price to cross above the channel, the support levels of $75, $65, and $55 may come to play out.
QNT/USD Medium-term Trend: Bearish (4H Chart)
According to the 4-hour chart, the Quant price is already hovering above the 9-day and 21-day moving averages, and the coin is also rising to cross above the upper boundary of the channel. Nevertheless, the technical indicator Relative Strength Index (14) is within the overbought region as the existing buyers dominate the market.
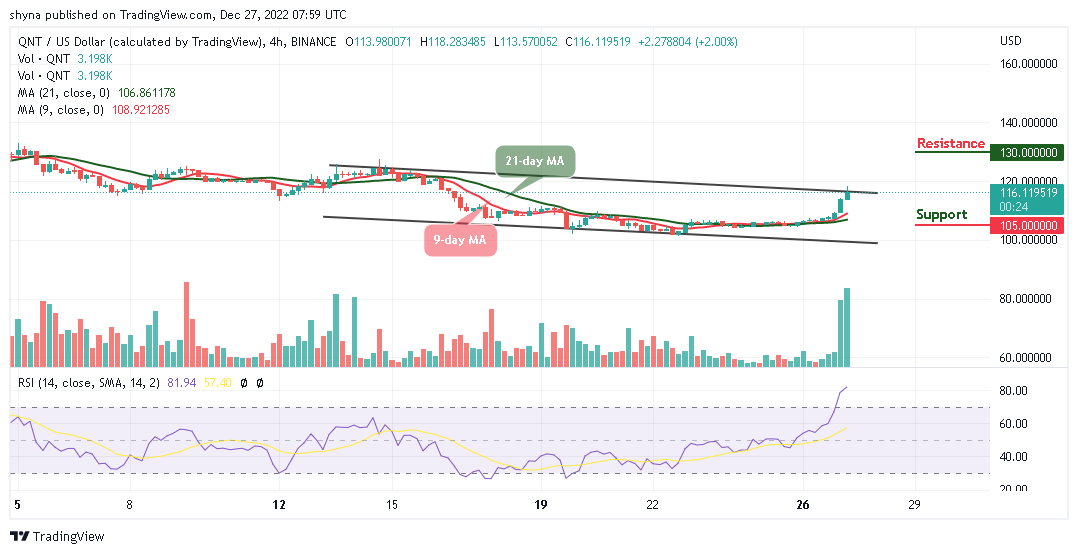
Moreover, if the bulls keep the market price on the upside, the Quant (QNT) would hit the potential resistance level of $130 and above. On the other hand, any bearish movement back to the downside could hit the support level at $105 and below.
Place winning Quant trades with us. Get QNT here