Quant Prediction: QNT/USD Ranges, More Buyers Anticipated
Estimated Reading Time: 3 minutes
Don’t invest unless you’re prepared to lose all the money you invest. This is a high-risk investment and you are unlikely to be protected if something goes wrong. Take 2 minutes to learn more
Quant Price Prediction – January 18
The Quant price prediction shows that QNT will recover to the upside as the coin gets ready for a cross above the channel.
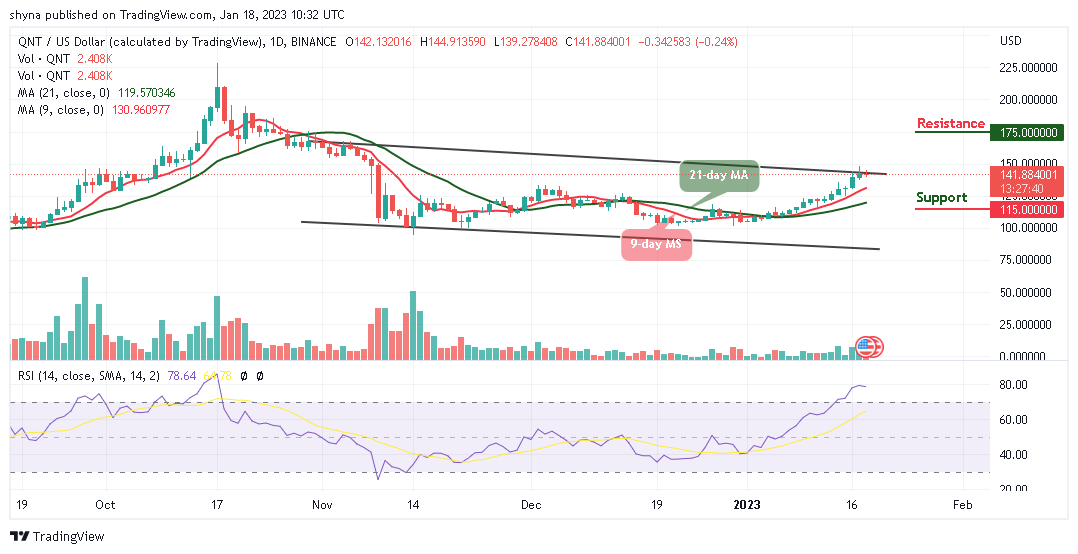
QNT/USD Medium-term Trend: Ranging (1D Chart)
Key Levels:
Resistance levels: $175, $195, $205
Support levels: $115, $95, $75
QNT/USD is moving sideways as the market price hovers above the 9-day and 21-day moving averages. Meanwhile, the market could become low for new and existing buyers to come to the market. Meanwhile, if the bulls fail to push the price to the upside, the Quant price may continue to range before gaining the upside.
Quant Price Prediction: QNT/USD Will Spike to the North
According to the daily chart, the Quant price will break above the upper boundary of the channel if the bulls increase the buying pressure and keep the coin above the 9-day and 21-day moving averages. Therefore, any further bullish movement above this barrier could hit the potential resistance levels of $175, $195, and $205.
Moreover, the upward movement could be delayed if the coin slides and faces the channel’s lower boundary; the market price could touch the support levels of $115, $95, and $75. Nonetheless, the technical indicator Relative Strength Index (14) is hovering within the overbought region, suggesting bullish movement.
QNT/USD Medium-term Trend: Bullish (4H Chart)
According to the 4-chart, the Quant price is consolidating within the channel. The coin is preparing to head to the upside if the major resistance level of $150 could be located. However, if the buyers push the price towards the upper boundary of the channel, crossing above it could hit the potential resistance at $155 and above.
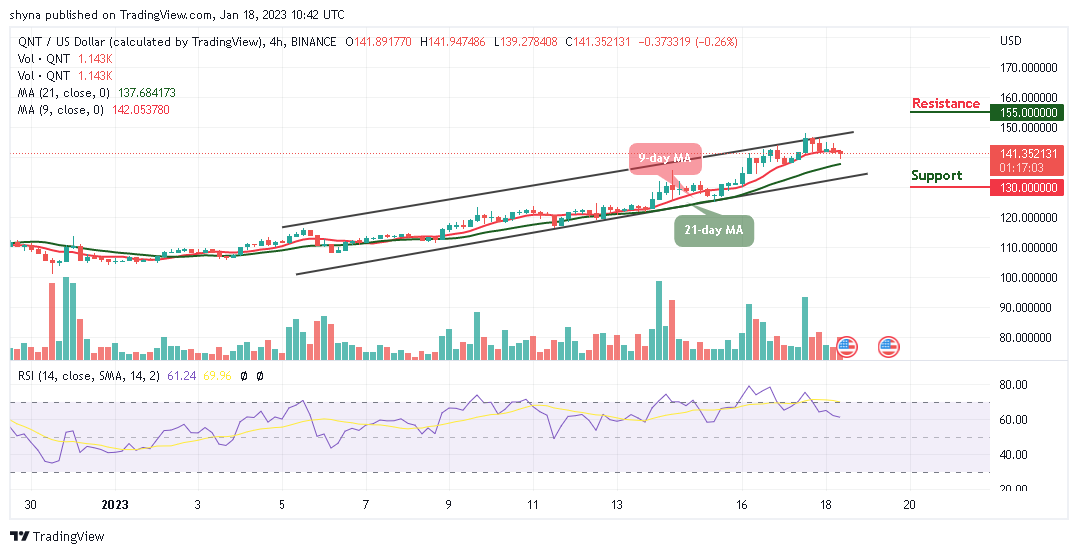
Meanwhile, the technical indicator Relative Strength Index (14) moves below the 60-level, indicating that the bulls are building momentum. Therefore, if the bulls fail to push the current market value to the upside, it could slide a little, and the nearest support level could be found at $130 and below.
Place winning Quant trades with us. Get QNT here