Quant Price Prediction: QNT/USD Consolidates Near $130; Price Will Climb Higher
Estimated Reading Time: 3 minutes
Don’t invest unless you’re prepared to lose all the money you invest. This is a high-risk investment and you are unlikely to be protected if something goes wrong. Take 2 minutes to learn more
Quant Price Prediction – March 21
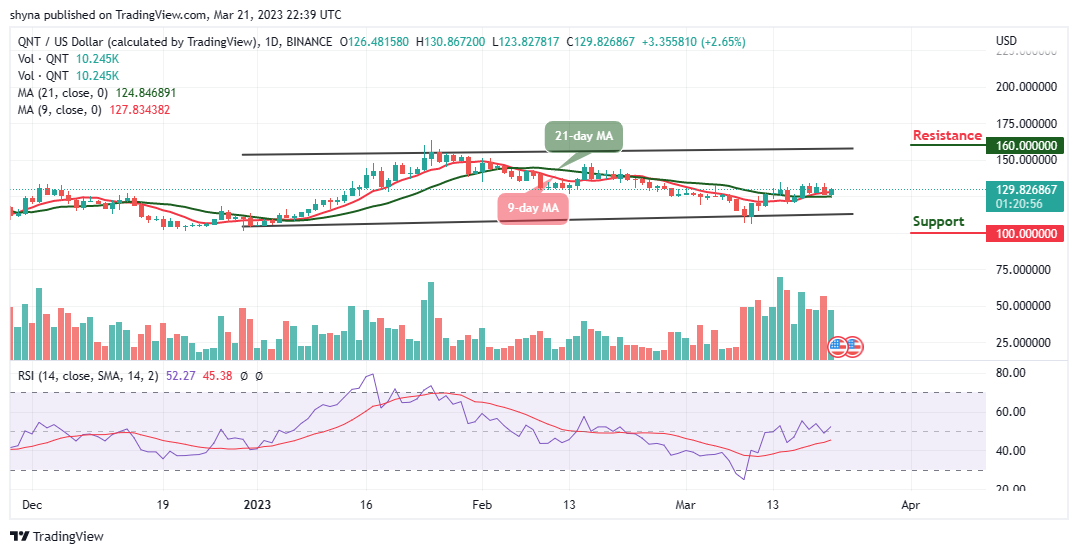
After touching the daily high of $130.86, the Quant price begins a downside correction which will move toward the resistance level of $135.
QNT/USD Long-term Trend: Ranging (Daily Chart)
Key levels:
Resistance Levels: $160, $170, $180
Support Levels: $100, $90, $80
QNT/USD is seen hovering around the $129.82 level as buying pressure coming up slightly. The market price even is crossing above the 9-day and 21-day moving averages. At the time of writing, the Quant price is still facing the upper boundary of the channel as it is up by 2.65%.
Quant Price Prediction: What to Expect from Quant (QNT)
The Quant price is likely to spike above the previous resistance level of $130 in the next few hours. Meanwhile, a decisive breakout below $120 support may intensify selling pressure if the bulls failed to push the coin to the north. Therefore, if bears bring the market price below the lower boundary of the channel, the consolidation may turn into a bear run.
However, the bulls need massive liquidity and volume to cross the $130 level and make a dash to the $140 level. The technical indicator Relative Strength Index (14) is seen moving above the 50-level but any sharp downward slope could be an indication of the influence which may allow bears to step back into the market.
Meanwhile, a continuous bullish movement is possible but only if the resistance at $130 is reclaimed. The persistence trade above this level may technically push the coin to the resistance levels of $160, $170, and $180 while the supports lie at $100 $90, and $80.
QNT/USD Medium-Term Trend: Bullish (4H Chart)
Looking at the 4-Hour chart, the Quant (QNT) is moving well above the 9-day and 21-day moving averages. The Quant price could create more gains if the bulls increase the buying pressure and could touch the nearest resistance level at $135.
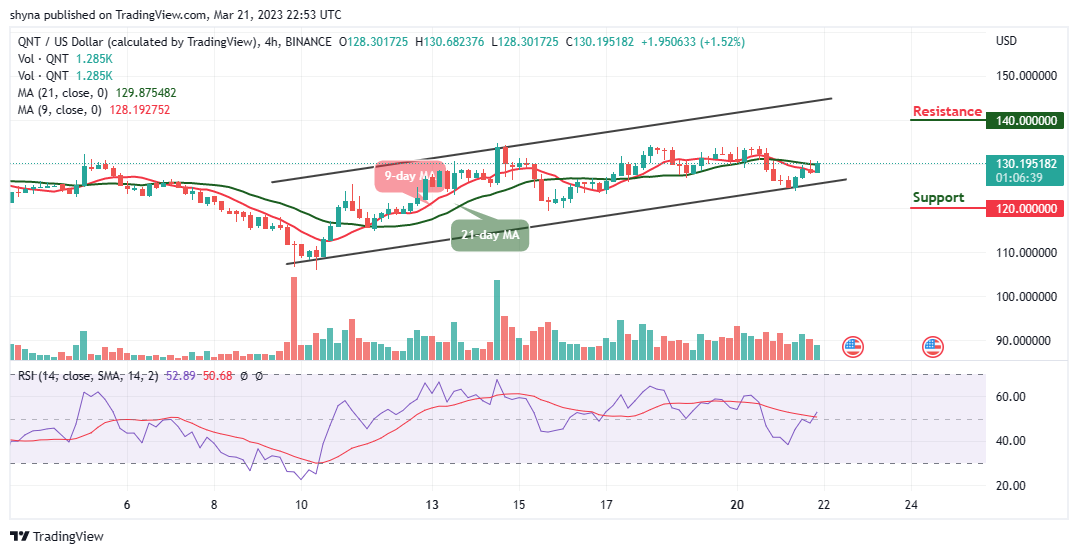
However, if the bulls energize the market, the price may likely test the resistance level of $140 and above. In other words, if the bears should step back into the market and drag it downward, then the support level of $120 and below could be visited but the Relative Strength Index (14) crosses above the 50-level, suggesting that more bullish signals may come into play.
Place winning Quant trades with us. Get QNT here