Quant Price Prediction: QNT/USD Keeps Ranging as Bulls Come to Focus
Estimated Reading Time: 2 minutes
Don’t invest unless you’re prepared to lose all the money you invest. This is a high-risk investment and you are unlikely to be protected if something goes wrong. Take 2 minutes to learn more
Quant Price Prediction – November 27
The Quant price prediction will begin to form higher as the coin prepares for the bullish movement above the moving averages.
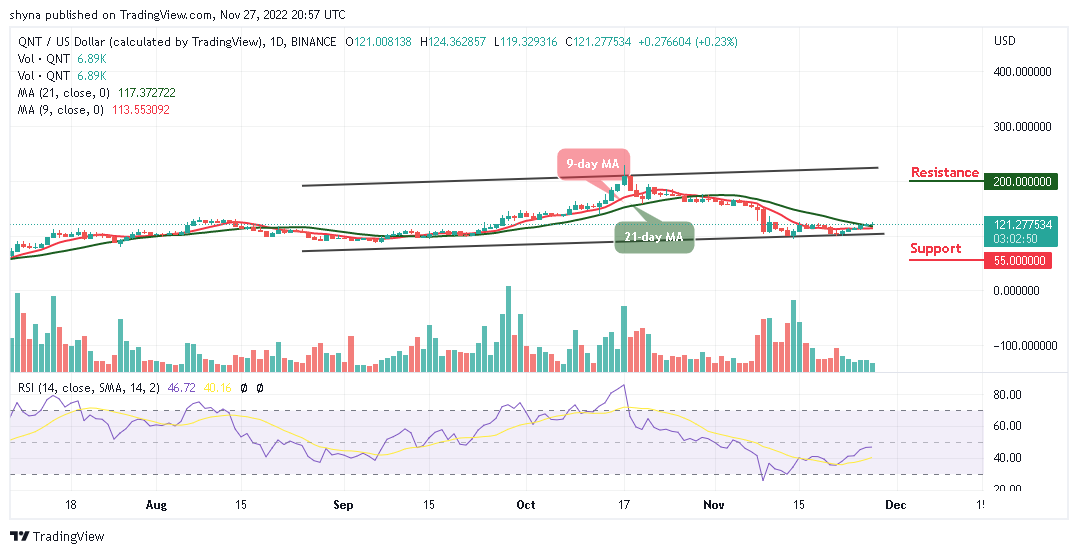
QNT/USD Medium-term Trend: Ranging (1D Chart)
Key Levels:
Resistance levels: $200, $220, $240
Support levels: $55, $35, $15
QNT/USD is trading above the 9-day and 21-day moving averages, but it’s yet to get to the upside. At the time of writing, the market price is hovering at $121.27, and it could become low to allow new investors to enter the market.
Quant Price Prediction: QNT/USD Will Retrace Back to the Top
The Quant price is making a retracement back above the 9-day and 21-day moving averages as soon as the bulls defend the $120 level. Any further bullish movement could push the coin toward the upper boundary of the channel which will hit the potential resistance levels of $200, $220, and $240 respectively.
On the contrary, the bullish movement could be delayed if the bears break below the channel’s lower boundary and may fall to the support levels of $55, $35, and $15. On the same note, the technical indicator Relative Strength Index (14) is moving to cross above the 50-level to increase the bullish movement in the following positive direction.
QNT/USD Medium-term Trend: Ranging (4H Chart)
Looking at the 4-hour chart, the Quant price ranges above the 9-day and 21-day moving averages as new buyers come into the market. However, the long-term moving averages will begin the bullish movement as the market prepares for a new trend.
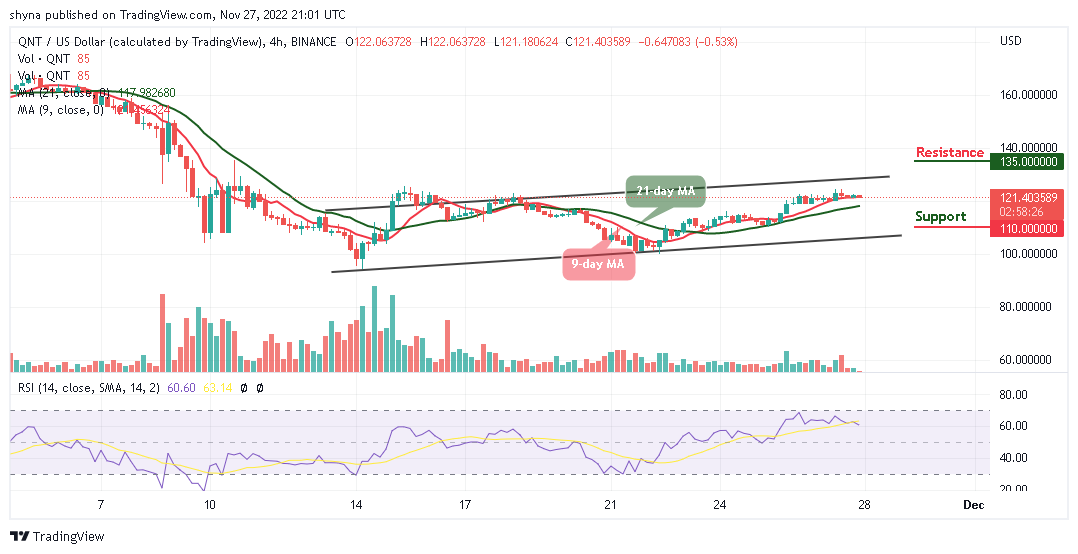
Moreover, if the buyers push the price above the channel’s upper boundary, it could reach the resistance level of $135 and above. At the moment, the technical indicator Relative Strength Index (14) stays above the 60-level, and should the bulls fail to move the current market value upward, the bears could bring the coin to the support level of $110 and below.
Place winning Quant trades with us. Get QNT here