Quant Price Prediction: QNT/USD Nosedives as Price Ready to Press Higher
Estimated Reading Time: 2 minutes
Don’t invest unless you’re prepared to lose all the money you invest. This is a high-risk investment and you are unlikely to be protected if something goes wrong. Take 2 minutes to learn more
Quant Price Prediction – December 13
The Quant price prediction shows that QNT would begin to form higher as the coin prepares to follow the bullish movement.
QNT/USD Medium-term Trend: Ranging (1D Chart)
Key Levels:
Resistance levels: $125, $130, $135
Support levels: $95, $90, $85
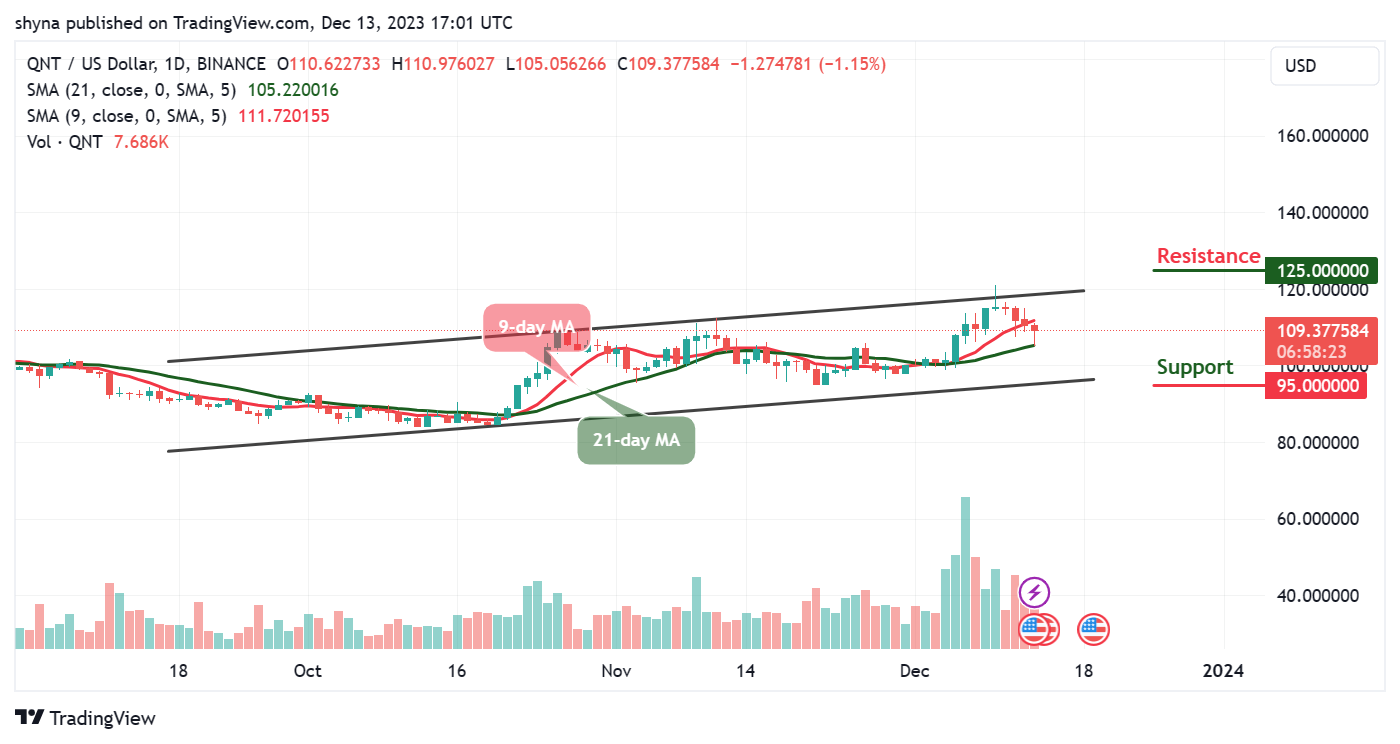
QNT/USD is sliding below the 9-day moving average as the coin recovers from the daily low of $105. However, the market price is currently hovering at $109.37, and the Quant price may retreat more to allow new investors to come into focus.
Quant Price Prediction: QNT/USD May Break to the Upside
The Quant price could rise and break above the upper boundary of the channel if the bulls can defend the $105 support level. However, any further bullish cross above the channel may push the coin to the potential resistance levels of $125, $130, and $135.
Meanwhile, this technical analysis may not play out if the sellers increase the selling pressure, crossing sliding toward the lower boundary of the channel could locate the nearest support at $100 while crossing below this barrier could hit the support levels of $95, $90, and $85. Moreover, the 9-day moving average is hovering above the 21-day moving average to prepare the coin for the bullish movement.
QNT/USD Medium-term Trend: Ranging (4H Chart)
Looking at the 4-hour chart, the Quant price would move up higher if the coin crosses above the 21-day moving average. However, the long-term moving averages may begin the bullish movement as the market prepares for a new trend.
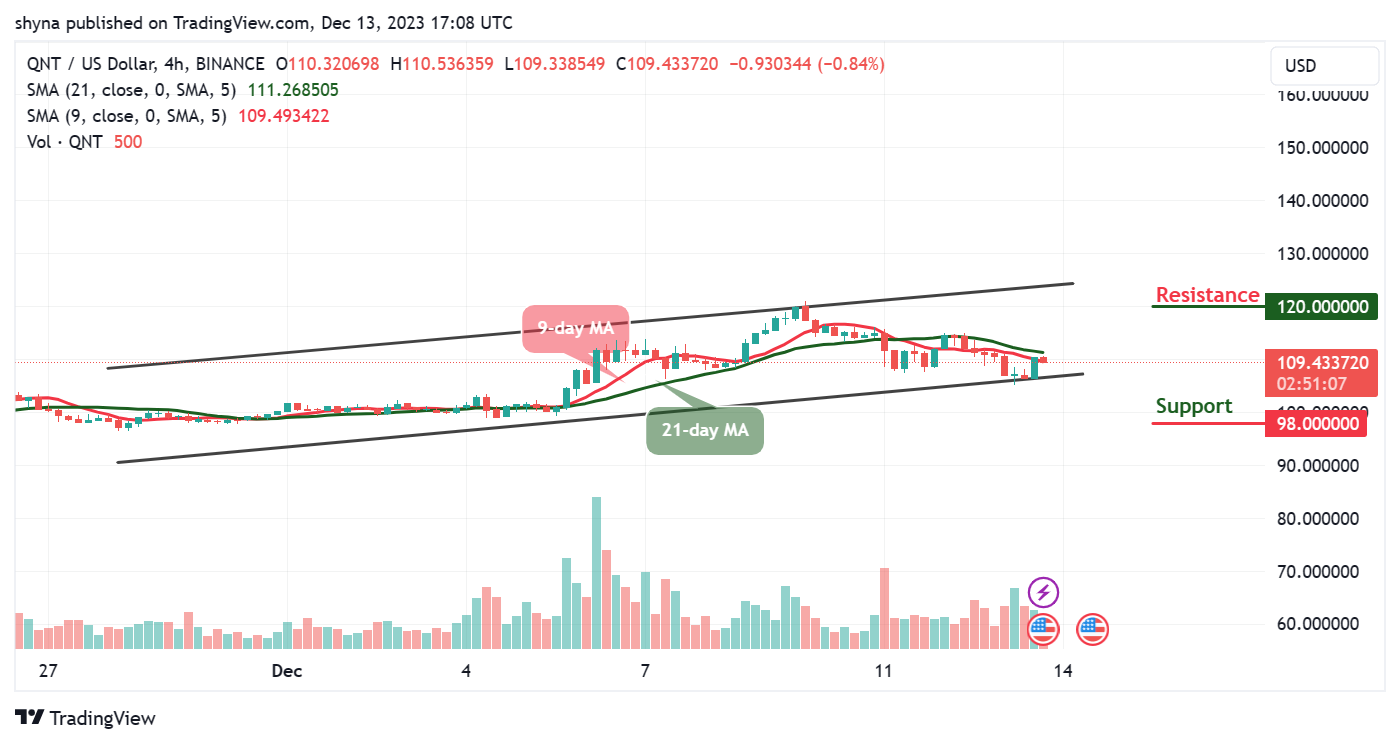
Nevertheless, if the buyers push the market price toward the upper boundary of the channel, higher resistance could be reached at $120 and above while 9-day MA remains below the 21-day MA to increase the bearish movement. Moreover, should the bulls fail to move the current market value above, the bears may increase the selling pressure, and the nearest support level could be located at $98 and below.
Place winning Quant trades with us. Get QNT here