Quant Price Prediction: QNT/USD Regains Strength as Price Touches $105 Level
Estimated Reading Time: 3 minutes
Don’t invest unless you’re prepared to lose all the money you invest. This is a high-risk investment and you are unlikely to be protected if something goes wrong. Take 2 minutes to learn more
Quant Price Prediction – November 15
The Quant price prediction shows that QNT is going to move to the upside as the coin touches the daily high at the $105 level.
QNT/USD Long-term Trend: Ranging (1D Chart)
Key Levels:
Resistance levels: $115, $120, $125
Support levels: $92, $87, $82
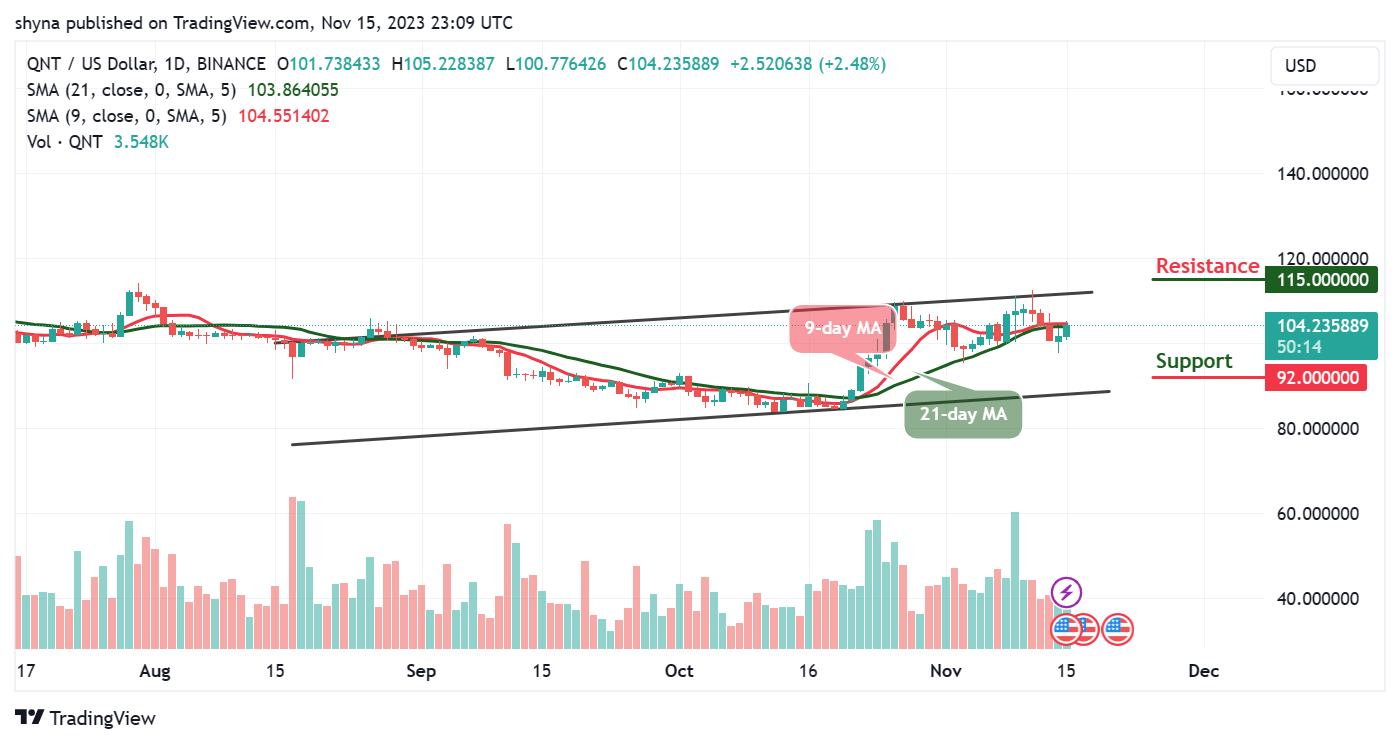
QNT/USD could hit the $110 resistance level in the next positive movement as the difficult time seems to be fading out for the coin. However, the Quant price is currently trading at $104.2, as the coin moves to cross above the 9-day moving average, it could probably touch the resistance level of $110 for it to move higher.
Quant Price Prediction: QNT/USD Will Spike to the Upside
The Quant price is seen hovering below the 9-day and 21-day moving averages. A break toward the upper boundary of the channel could encourage more buyers to increase their entries, and they could push the coin to hit the resistance levels of $115, $120, and $125. On the contrary, if the price slides and heads toward the lower boundary of the channel, the sell-off could push the coin to the negative side.
However, if the support level of $100 is broken, the downside pressure may increase while the next supports could be located at $92, $87, and $82 as the buyers could get ready to buy the dip. Meanwhile, the 9-day MA may need to stay above the 21-day MA so that the new buyers can invest in the coin.
QNT/USD Medium-term Trend: Ranging (4H Chart)
On the 4-hour chart, the Quant price is hovering above the 9-day and 21-day moving averages to confirm the bullish movement. If the coin moves toward the upper boundary of the channel, it will encourage the bulls to hit the resistance level of $112 and above.
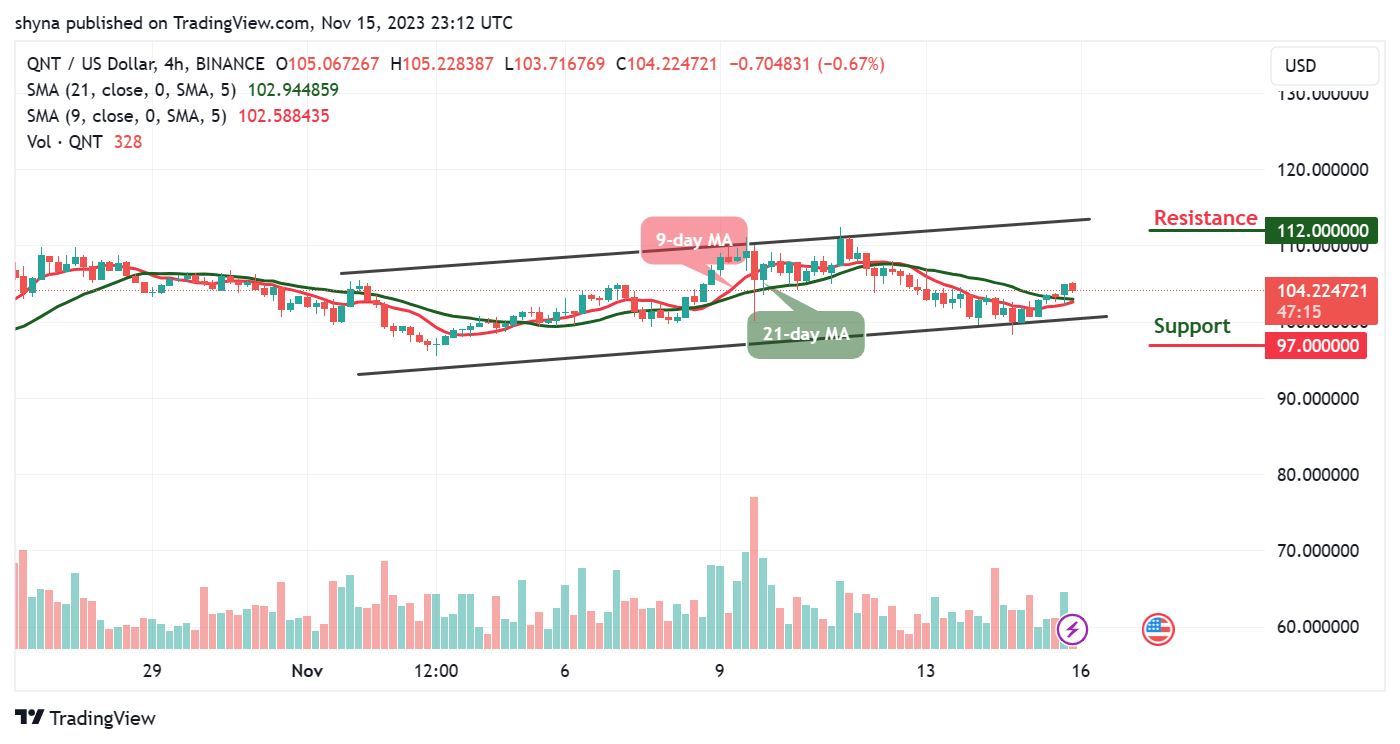
Nevertheless, any bearish movement below the moving averages could take the coin to the support level of $97 and below. Moreover, there is a possibility that the Quant could retreat before moving to the upside but the 9-day moving average is likely to cross above the 21-day moving average, suggesting a bullish movement for the coin.
Place winning Quant trades with us. Get QNT here