Quant Price Prediction: QNT/USD Shoots Near $140 Resistance
Estimated Reading Time: 3 minutes
Don’t invest unless you’re prepared to lose all the money you invest. This is a high-risk investment and you are unlikely to be protected if something goes wrong. Take 2 minutes to learn more
Quant Price Prediction – January 20
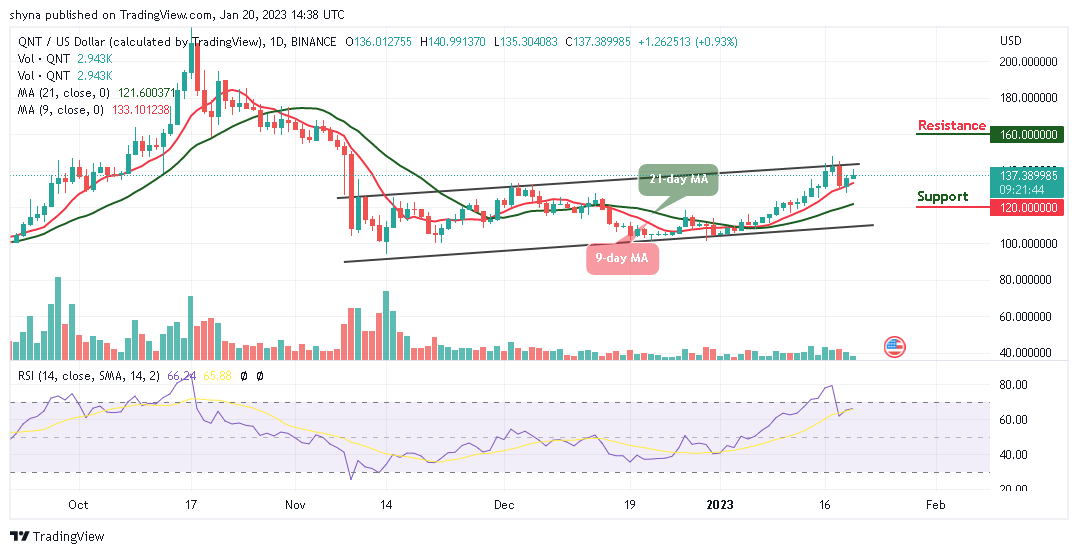
As the daily chart reveals, the Quant price is trading near the resistance level of $140 as the recovery comes slowly.
QNT/USD Long-term Trend: Bullish (Daily Chart)
Key levels:
Resistance Levels: $160, $165, $170
Support Levels: $120, $115, $110
At the time of writing, QNT/USD is seen trading at $137.38 as the coin heads toward the 9-day and 21-day moving averages. The Quant price will create additional gains if the bulls increase the buying pressure within the market.
Quant Price Prediction: Quant (QNT) Could Spike to the Upside
On the bullish side, the Quant price needs to cross above the upper boundary of the channel, otherwise, there may be a bearish breakdown if QNT/USD cross below the 9-day and 21-day moving averages. The 9-day MA and the 21-day MA are going to cross each other as the technical indicator Relative Strength Index (14) is sending moderate signs where the signal line moves to cross above the 70-level.
However, QNT/USD will confirm the bullish trend if the market price moves above $140. Meanwhile, the Quant price could follow the bearish trend if the price retreats below the 21-day moving average and face the lower boundary of the channel. Should this come to play, the Quant price can drop to the critical supports of $120, $115, and $110. Otherwise, a strong bullish spike may push the price toward the resistance levels of $160, $165, and $170.
QNT/USD Medium-Term Trend: Ranging (4H Chart)
Looking at the 4-hour chart, the Quant price is currently moving to cross above the 9-day and 21-day moving averages. If the price continues to rise further and heads toward the upper boundary of the channel, it could reach the nearest resistance level at $155 and above.
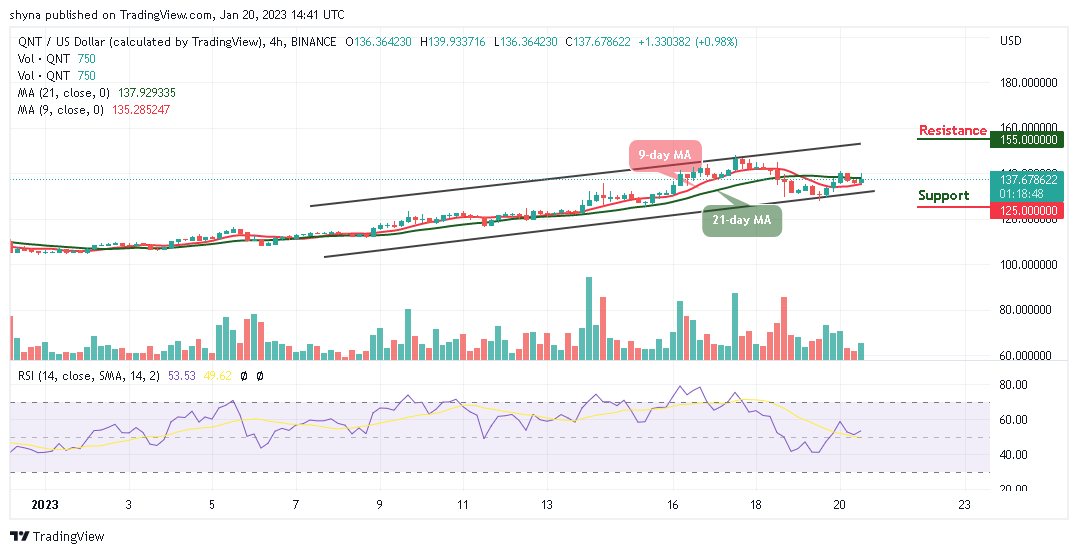
On the contrary, if the bears bring the coin below the lower boundary of the channel, the market price could reach the closest support at $125 and below. At the moment, the technical indicator Relative Strength Index (14) is seen moving above the 50-level, suggesting a bullish trend for the market.
Place winning Quant trades with us. Get QNT here