Quant Price Prediction: QNT/USD Touches $106 Level; Buy Now
Estimated Reading Time: 3 minutes
Don’t invest unless you’re prepared to lose all the money you invest. This is a high-risk investment and you are unlikely to be protected if something goes wrong. Take 2 minutes to learn more
Quant Price Prediction – April 21
After touching the daily high of $111, the Quant price will retreat a little before creating another high toward the channel.
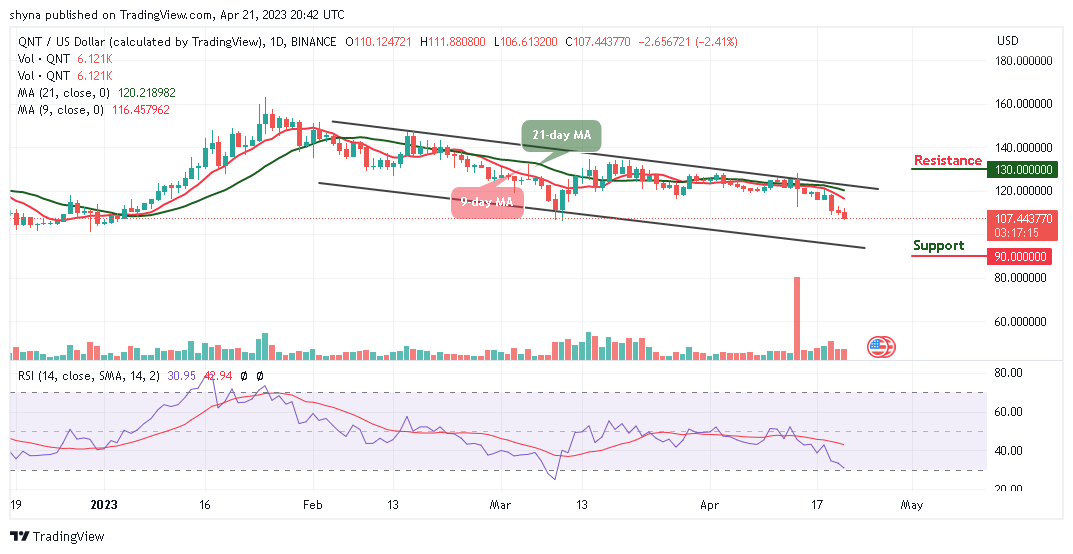
QNT/USD Long-term Trend: Bearish (Daily Chart)
Key levels:
Resistance Levels: $130, $135, $140
Support Levels: $90, $85, $80
QNT/USD is hovering around $107.4 as buying pressure cooled off a little. The market price could form a low at nearly $100 before heading to the upside. As of now, the Quant price stays below the 9-day and 21-day moving averages as the new buyers are expected to come into the market while the existing buyer could buy the dips.
Quant Price Prediction: What to Expect from Quant (QNT)
The Quant price is presently correcting lower, and a decisive break below $100 support may intensify selling pressure. However, buyers and sellers were struggling with each other as the price is trading below the 9-day and 21-day moving averages. Should in case there is a breakout around the $115 level, the Quant price will increase to the resistance level at $120, which may increase to $125.
However, bulls need massive liquidity and volume to cross above the upper boundary of the channel. The technical indicator Relative Strength Index (14) is seen moving into the oversold region as the sharp downward slope is a clear indication of the influence, which may allow more investors to come into the market.
Meanwhile, a persistent trade above the upper boundary of the channel could technically push the coin to the resistance levels of $130, $135, and $140, while the supports lie at $90, $85, and $80.
QNT/USD Medium-Term Trend: Bearish (4H Chart)
Looking at the 4-Hour chart, Quant (QNT) has not yet slipped below the lower boundary of the channel but is in the loop of making a bounce back. The Quant price hovers below the moving averages and would begin to follow the bullish movement if the coin crosses above the moving averages.
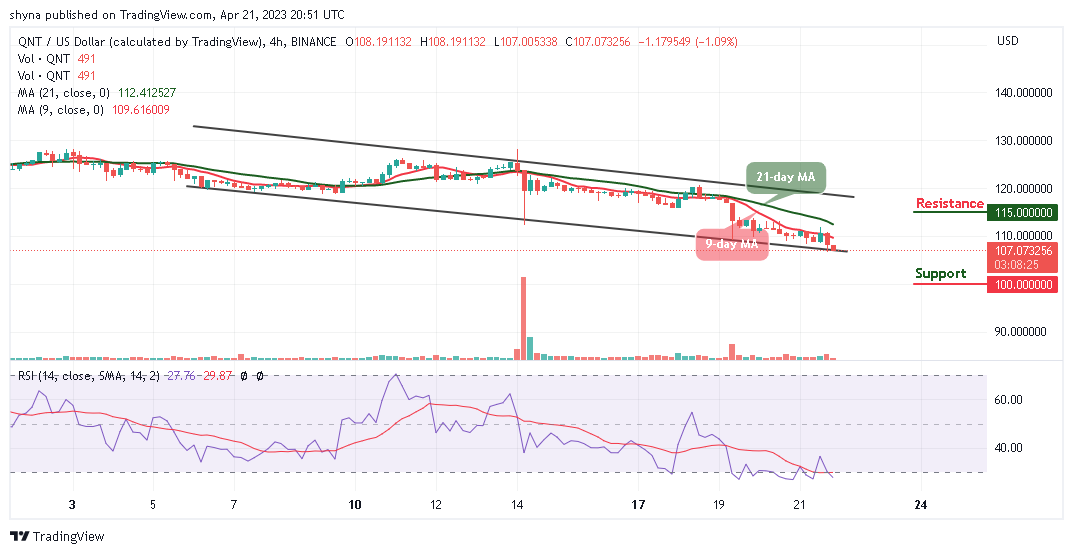
However, if the bulls energize the market, the price will hit the resistance level of $115 and above. In other words, if the bears hold the price and drag it downward, the support level of $100 and below may be visited as the Relative Strength Index (14) moves into the oversold region, and more buyers are expected to come in.
Place winning Quant trades with us. Get QNT here