Quant Price Prediction: QNT/USD Trades Above $122 as Price Heads to the Upside
Estimated Reading Time: 3 minutes
Don’t invest unless you’re prepared to lose all the money you invest. This is a high-risk investment and you are unlikely to be protected if something goes wrong. Take 2 minutes to learn more
Quant Price Prediction – December 14
The Quant price prediction reveals that if bulls keep the market price above the moving averages, QNT will head to the upside.
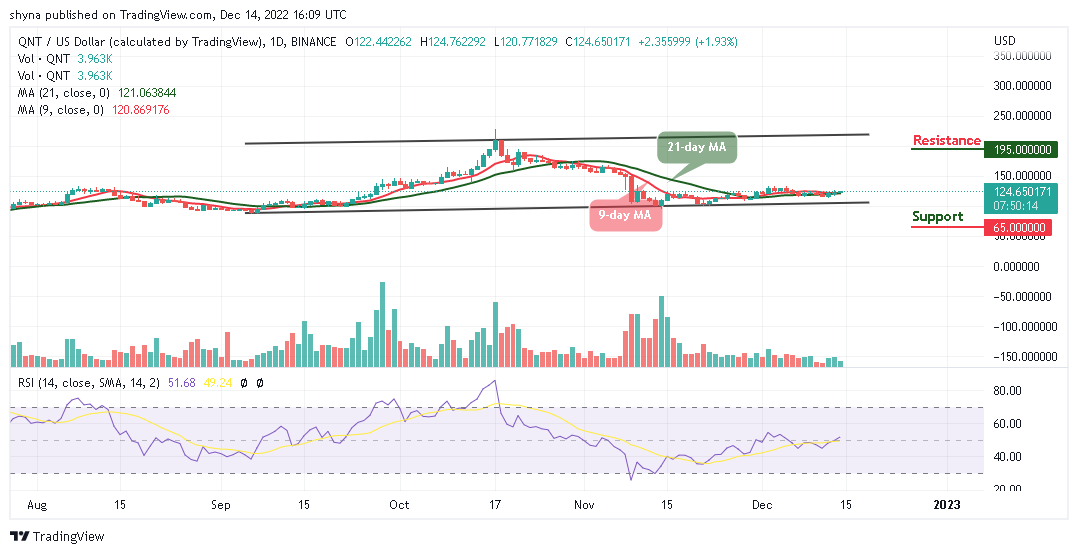
QNT/USD Medium-term Trend: Ranging (1D Chart)
Key Levels:
Resistance levels: $195, $215, $235
Support levels: $65, $45, $25
QNT/USD is at the time of writing moving towards the north, trading above the 9-day and 21-day moving averages. However, as the coin hovers at $124.6, the bullish momentum will push the coin toward the resistance level of $150 resistance level. Nevertheless, if the bulls fail to drive the price towards the upper boundary of the channel, the Quant price could slide below the moving averages.
Quant Price Prediction: QNT/USD Heads to the Upside
The Quant price is changing hands at $124.6 where it could reclaim the resistance level of $125. The coin may stay above the 9-day and 21-day moving averages so that it can locate the potential resistance levels at $195, $215, and $235. Meanwhile, the support levels could be found at $65, $45, and $25 for the new buyers to come into the market while the technical indicator Relative Strength Index (14) crosses above the 50-level.
QNT/USD Medium-term Trend: Ranging (4H Chart)
The Quant price keeps hovering above the 9-day moving average and could head toward the upper boundary of the channel if the buyers increase the pressure. The technical indicator Relative Strength Index (14) remains above the 60-level, which suggests that the coin could gain additional uptrends. Many buyers are encouraged to enter the market and it could be the best time to invest in the coin.

However, any bearish movement below the lower boundary of the channel could hit the support level of $115 and below. Nevertheless, QNT/USD is displaying some bullish signals as the market price keeps rising above the 9-day and 21-day moving averages, therefore, the Quant price may locate the potential resistance at $140 and above.
Place winning Quant trades with us. Get QNT here