Ripple Faces Rejection at $1.08, May Revisit Previous Low at $1.00
Estimated Reading Time: 2 minutes
Don’t invest unless you’re prepared to lose all the money you invest. This is a high-risk investment and you are unlikely to be protected if something goes wrong. Take 2 minutes to learn more
Ripple (XRP) Long-Term Analysis: Bullish
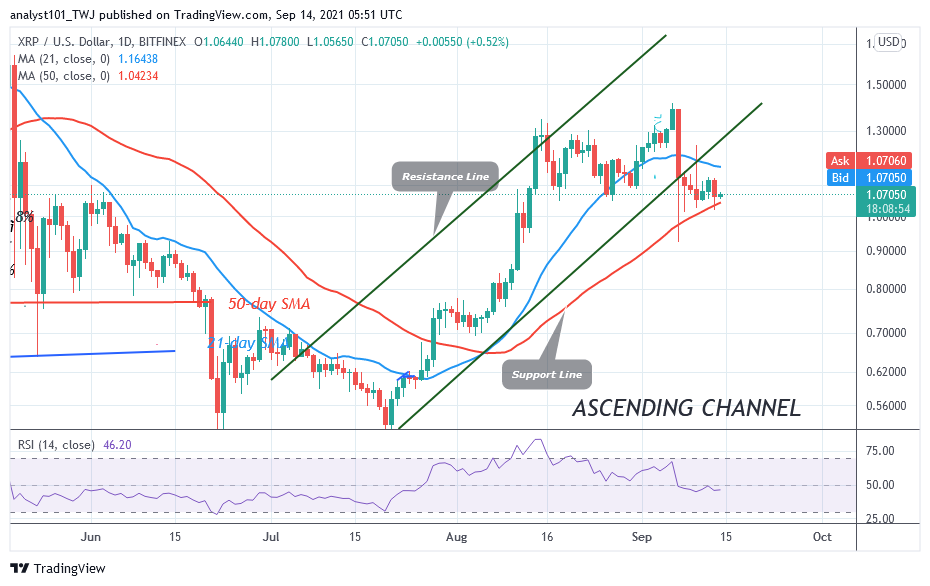
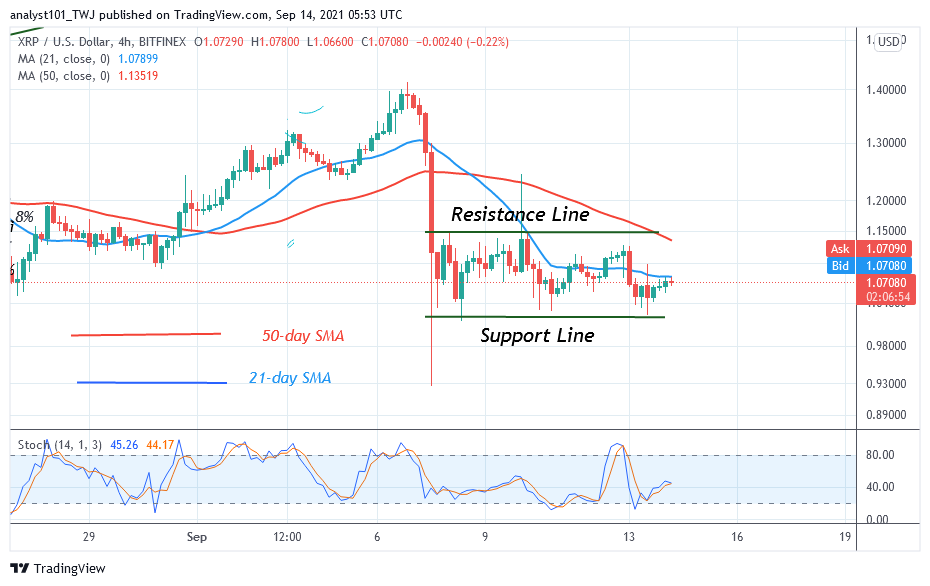
Ripple’s (XRP) price has fallen to the support above the 50-day SMA. XRP is between the 21-day SMA and the 50-day SMA. For the past week, the XRP price has been consolidating above the 50-day SMA. On the downside, if the bears break below the 50-day SMA, the market will further decline to the low of either $0.92 or $0.70. Similarly, if the bulls break above the 21-day SMA, it will signal the resumption of the uptrend. Buyers will attempt to push XRP to the previous highs of $1.15 and $1.25. Today, a bullish candlestick is above the 50-day SMA indicating a possible upward move.
Ripple (XRP) Indicator Analysis
XRP/USD is at level 46 of the Relative Strength Index period 14. It indicates that the crypto is in the downtrend zone and capable of falling to the downsides. Presently, XRP has fallen to the support above the 50-day SMA. XRP is above the 50% range of the daily stochastic. It indicates that Ripple is in a bullish momentum. The altcoin is rising marginally on the upside.
Technical indicators:
Major Resistance Levels – $2.00, $2.50, $3.00
Major Support Levels – $1.50, $1.00, $0.50
What Is the Next Direction for Ripple (XRP)
Ripple is range-bound between levels $1.00 and $1.15. The crypto is likely to be range-bound for a few more days. The altcoin is not likely to trend. On the 4-Hour chart, the price bars are facing rejection at the 21-day SMA.
You can purchase crypto coins here. Buy Tokens
Note: Cryptosignals.org is not a financial advisor. Do your research before investing your funds in any financial asset or presented product or event. We are not responsible for your investing results