Ripple (XRP) Rebounds above $0.60 Support, Attains a New High of $1.10
Estimated Reading Time: 2 minutes
Don’t invest unless you’re prepared to lose all the money you invest. This is a high-risk investment and you are unlikely to be protected if something goes wrong. Take 2 minutes to learn more
Ripple (XRP) Long-Term Analysis: Bullish
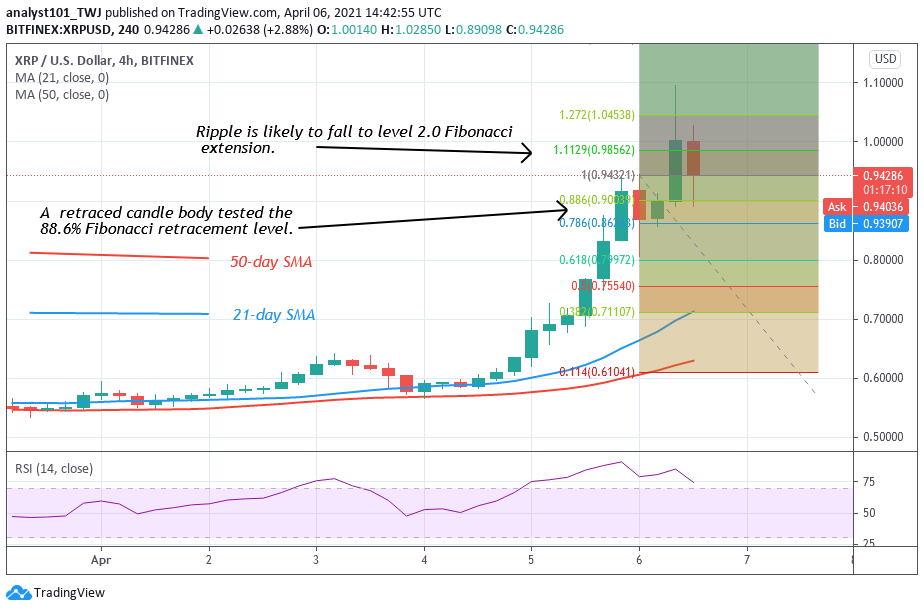
Ripple price is making positive moves as it rebounded above the $0.60 support and rallied to a peak price of $1.10. The recent rally breaches the resistance levels of $0.60, $0.65, and $0.78. XRP price has reached the overbought region of the market and sellers emerge to pushes down. Meanwhile, the price indicator has signaled an upward movement of price. On April 6 uptrend; a retraced candle body tested the 88.6% Fibonacci retracement level. This retracement implies that XRP will rise to level 1.1129 Fibonacci extension or the high of $0.985. The price action has tested the 1.1129 Fibonacci extension and reversed from the recent high.
Ripple (XRP) Indicator Analysis
XRP is at level 74 of the Relative Strength Index period 14. It indicates that the crypto has no room to rally on the upside. Also, XRP is in the bullish trend zone. The 21-day SMA and the 50-day SMA are sloping up indicating the uptrend.
Technical indicators:
Major Resistance Levels – $0.90, $0.95, $1.10
Major Support Levels – $0.50, $0.45, $0.40
What Is the Next Direction for Ripple (XRP)?
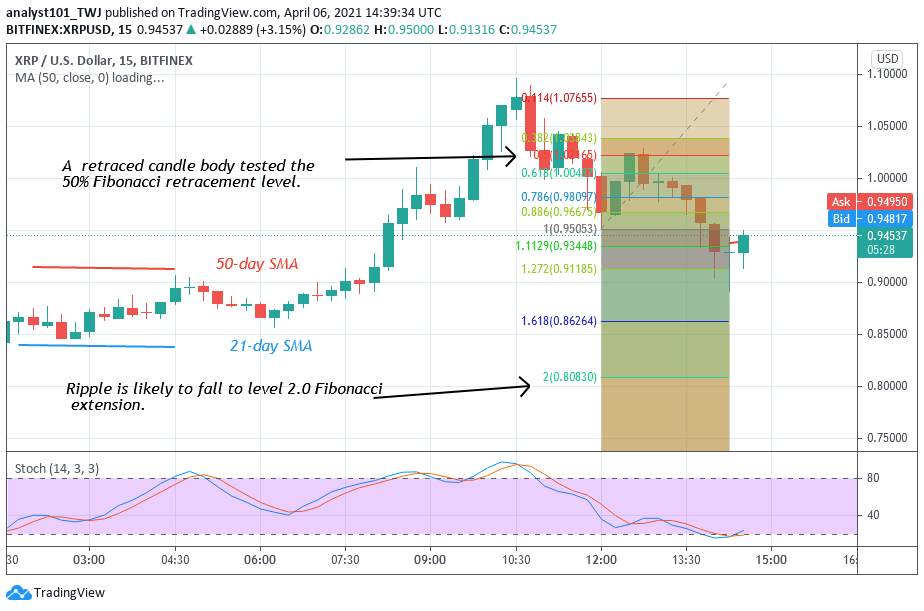
Presently, Ripple is retracing after reaching the recent high of $1.10. The Fibonacci tool has indicated a downward movement of price. On the downtrend of April 6, a retraced candle body tested the 50% Fibonacci retracement level. This retracement implies that XRP will fall to level 2.0 Fibonacci extensions or the low of $0.80. From the price action, the market has fallen to level $0.92 low.
Note: cryptosignals.org is not a financial advisor. Do your research before investing your funds in any financial asset or presented product or event. We are not responsible for your investing results