Ripple (XRP) Retests $0.51support, May Slide to $0.36 Low
Estimated Reading Time: 2 minutes
Don’t invest unless you’re prepared to lose all the money you invest. This is a high-risk investment and you are unlikely to be protected if something goes wrong. Take 2 minutes to learn more

Ripple (XRP) Long-Term Analysis: Bearish
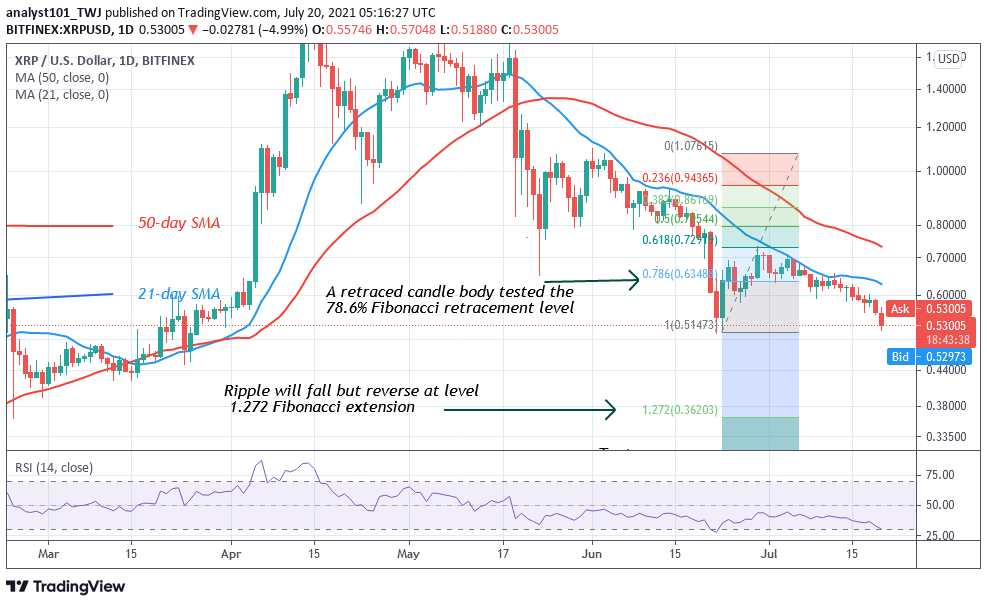
Ripple’s (XRP) has been in a downward move, following its rejection from the $0.70 high. The altcoin has fallen to the low of $0.52 but is yet to break the previous low at $0.51. The selling pressure is likely to continue as price corrected upward but was repelled at the $0.70 high.However, if the $0.51 support is breached, Ripple will decline to either $0.41 or $0.36 low. On the other hand, if the support holds; Ripple is likely to resume upside momentum above the previous low. Meanwhile, on June 22 downtrend; a retraced candle body tested the 78.6% Fibonacci retracement level. The retracement indicates that Ripple is likely to fall but reverse at level 1.272 Fibonacci extension or level $0.36.
Ripple (XRP) Indicator Analysis
Ripple is at level 30 of the Relative Strength Index period 14. It indicates Ripple has reached the oversold region. The 21-day and the 50-day SMAs are sloping downward indicating the downtrend. According to daily stochastic, Ripple is below the 20% range of the daily stochastic. That is, XRP is trading in the oversold region of the market.

Technical indicators:
Major Resistance Levels – $2.00, $2.50, $3.00
Major Support Levels – $1.50, $1.00, $0.50
What Is the Next Direction for Ripple (XRP)
Ripple’s (XRP) downward move is facing resistance as bulls defend the previous low at $0.51. The bears have not sufficiently broken below the $0.51 support level. Meanwhile, on July 14 downtrend; a retraced candle body tested the 50% Fibonacci retracement level. The retracement indicates that Ripple is likely to fall to level 2.0 Fibonacci extension or level $0.52. From the price action, XRP has retested the 2.0 Fibonacci extension but has not indicated further downsides.

You can purchase crypto coins here. Buy Tokens
Note: Cryptosignals.org is not a financial advisor. Do your research before investing your funds in any financial asset or presented product or event. We are not responsible for your investing results
