SHIBUSD Bulls Attempt Recovery from $0.00001240 Key Support
Estimated Reading Time: 2 minutes
Don’t invest unless you’re prepared to lose all the money you invest. This is a high-risk investment and you are unlikely to be protected if something goes wrong. Take 2 minutes to learn more

SHIBUSD Price Analysis – Buyers Are Building Against Sell Pressure
SHIBUSD price forecast shows bulls attempting a recovery as they defend the $0.00001240 support level. It seems like the crypto price action is hinting at a potential reversal.
SHIBUSD Key Levels
Support Levels: $0.00001240, $0.00001190
Resistance Levels: $0.00001590, $0.00001860
 The daily chart depicts a recent decline where sellers pushed prices from above $0.00001860 to test the $0.00001240 support. Buyers have shown resilience, absorbing selling pressure at this level, with price stabilizing just above the Parabolic SAR dots. This indicator have recently flipped below the price action, signaling a potential shift in momentum.
The market structure suggests cautious investor participation, with accumulation occurring near support as traders eye a possible bounce. The Momentum indicator remains flat near zero, indicating a lack of strong directional momentum but supporting the idea of a consolidation phase.
The current price action reflects a battle between bulls and bears near the $0.00001243 support. Sellers dominated the recent downtrend, but their momentum appears to be waning as buyers step in to defend this level. This accumulation suggests growing investor confidence in a potential upward move, though a break above $0.00001599 is needed to confirm bullish intent. The Parabolic SAR’s recent shift below price reinforces the possibility of a short-term bottom.

Market Expectation
The 4-hour chart shows a tighter range, with price stabilizing around $0.00001270 after testing support at $0.00001230. Buyers are actively defending this zone, as evidenced by the Parabolic SAR dots remaining below the price, indicating bullish momentum on this timeframe.
Sellers have struggled to push lower, suggesting diminishing selling pressure. The Momentum indicator is showing a slight uptick, hinting at increasing buying interest.
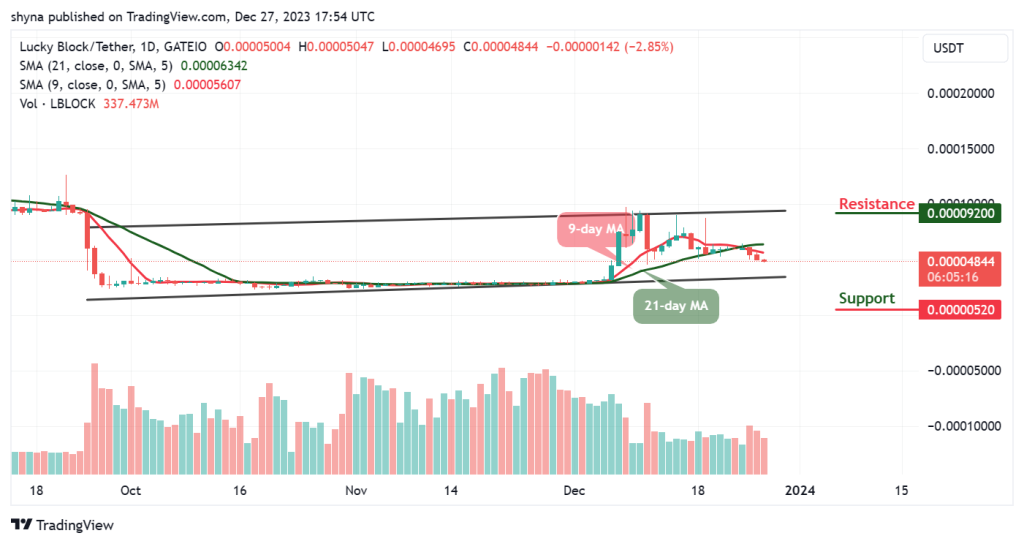
You can purchase Lucky Block here. Buy LBLOCK
Note: Cryptosignals.org is not a financial advisor. Do your research before investing your funds in any financial asset or presented product or event. We are not responsible for your investing result.