Solana (SOL) Price Prediction: SOL/USDT Trades Above the $140 Threshold
Estimated Reading Time: 3 minutes
Don’t invest unless you’re prepared to lose all the money you invest. This is a high-risk investment and you are unlikely to be protected if something goes wrong. Take 2 minutes to learn more
Solana (SOL) Price Prediction: August 16
Price activity in the Solana daily market exited an oscillation period between the $202 and $173 price range on April 12th and entered a broader oscillation range between $185 and $123. This latter range has largely held up until now.
SOL/USDT Long-term Trend: Bullish (Daily Chart)
Key Price Levels:
Resistance Levels: $150, $170, and $190
Support Levels: $140, $120, and $100
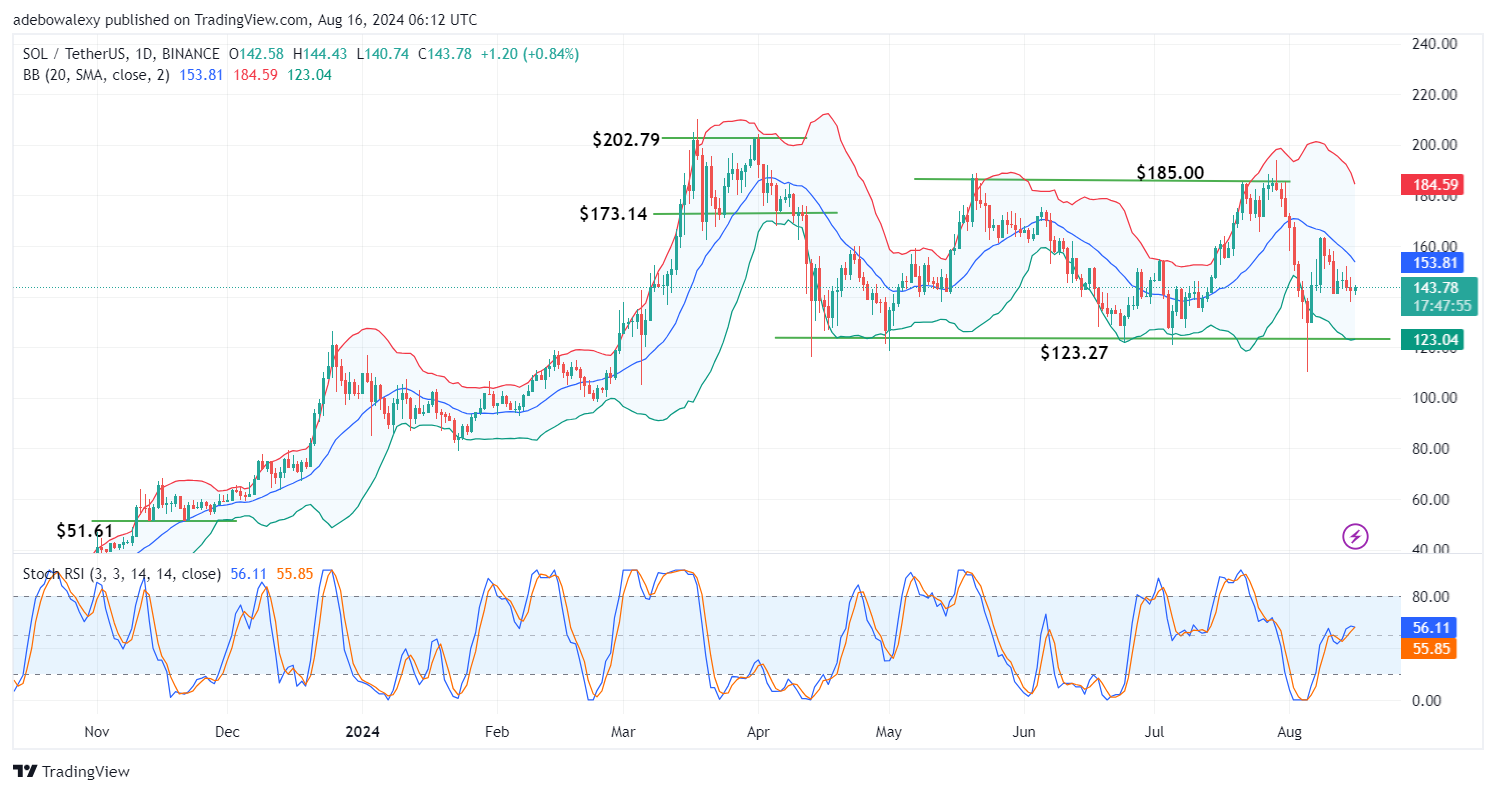
Price action in the SOL/USDT daily market has once again approached the support at the $140 price level after retreating below the middle band of the Bollinger Bands. The ongoing session appears green, indicating some price increases. However, the size of the corresponding price candle shows that the price increase is quite small. The Stochastic Relative Strength Index (SRSI) lines are still on an upward trajectory but have already converged.
Solana Price Prediction: SOL/USDT Buyers Need to Gain More Momentum
Solana’s daily market has only seen a minor price increase. This gain seems quite vulnerable, given the size and position of the last price candle. The position of the last price candle suggests that headwinds may quickly reverse the recent price increase.
The Bollinger Bands indicator has a downward trajectory, indicating that downward forces are more dominant. The SRSI indicator is also converged, signaling a potential crossover. Technically, this hints that buyers will need to gather more momentum if the upward retracement is to be defended for short-term gains.
Solana Price Prediction: SOL/USDT Price Action Consolidates Just Above the $140 Mark (4-Hour Chart)
In the SOL/USDT 4-hour market, the Bollinger Bands indicator appears to have contracted considerably due to reduced volatility. The last price candle is green and has kept the market above the $140 threshold. However, trading continues below the middle band of the Bollinger Bands. Meanwhile, the SRSI lines have an upward trajectory, but the movement appears quite jerky.
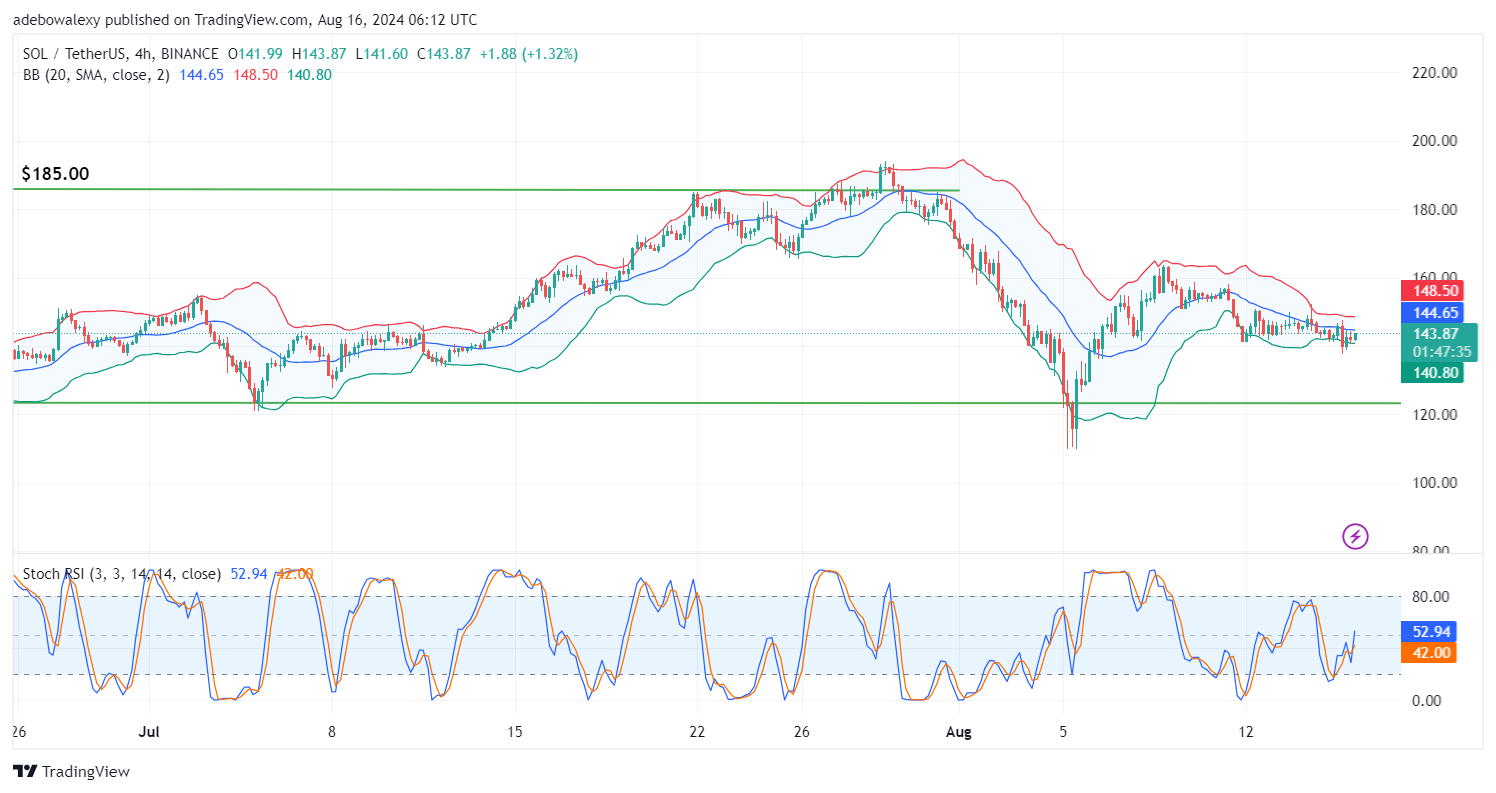
The position of the price candle corresponding to the ongoing session suggests that price action is still subdued. On the other hand, the contracted appearance of the Bollinger Bands suggests that the market is coiling up, and a significant move may occur soon. For bulls to benefit from this, it would be preferable if the market rises above the middle band of the Bollinger Bands. This could push the market toward the $160 mark and beyond.