Solana (SOL/USD) Market Elongates Moves in Ranges
Estimated Reading Time: 3 minutes
Don’t invest unless you’re prepared to lose all the money you invest. This is a high-risk investment and you are unlikely to be protected if something goes wrong. Take 2 minutes to learn more

Free Crypto Signals Channel
Solana Price Prediction – August 5
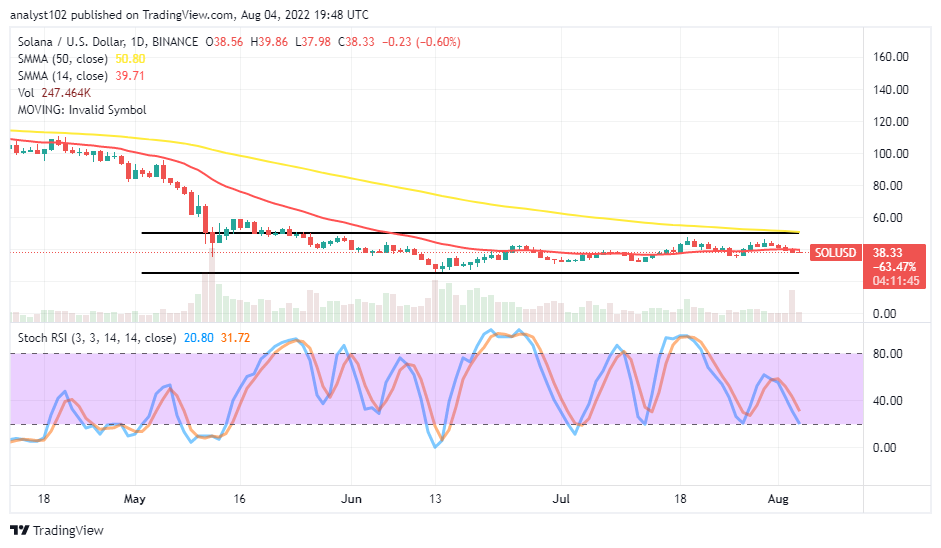
It shows that the SOL/USD market elongates moves in ranges of $25 and $50. Price is trading around $38 at a minute negative percentage rate of 0.60.
SOL/USD Market
Key Levels:
Resistance levels: $50, $60, $70
Support levels: $25, $20, $15
SOL/USD – Daily Chart
The SOL/USD daily chart showcases the crypto-economic market elongates moves in ranges of $25 and $50. The 50-day SMA indicator is at $50.80 above the 14-day SMA indicator. The upper horizontal line drew at the immediate resistance level, and the lower horizontal is at the lower support line. The smaller SMA is located within them, trending toward the east direction to indicate a sideway motion is ongoing in the market. The Stochastic Oscillators have crossed southbound to find a touch around the 20 range.
Should traders start to look out for trading outside in the range-bound spots of the SOL/USD now?
Time seems not yet warranting the technical thinking to trade outside the current range-bound spots of the SOL/USD market as the crypto economy elongates moves in ranges of $25 and $50. Currently, the trading outlook reveals a slight correction of the price action, trying to breach the 14-day SMA trend line to the downside that can bring about the getting of support by the crypto trade in no time. Therefore, long-position placers may be alert when a bullish candlestick occurs before considering a buying order.
On the downside of the technical analysis, as it indicated that a price correction is in force, launching a selling order at this moment may run into a late entry that bears can get trapped in time. The move to the south shows a weakness that doesn’t support, placing a new selling position. Short-position takers are to suspend joining the move to the downside until another round of pattern forms at a higher-resistance spot.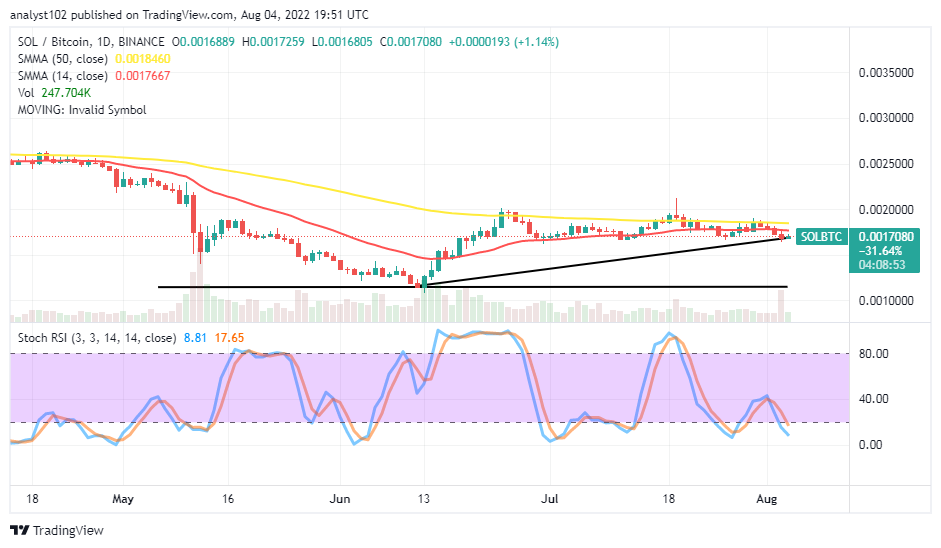
SOL/BTC Price Analysis
Solana still maintains a firm stance to some reasonable degree, holding against the trending catalyst of Bitcoin at higher resistance spots over a couple of sessions. The currency pair market elongates moves in ranges around the trend lines of the SMAs. The 14-day SMA indicator is closely beneath the 50-day SMA indicator. The bullish trend line drew northward near underneath the smaller SMA to the bottoms of candlesticks formed there-off. The Stochastic Oscillators have slightly dipped past the range of 20 into the oversold region. And they are seemingly trying to cross back northbound to denote the base crypto is still struggling to push against its counter-trading crypto.
Note: Cryptosignals.org is not a financial advisor. Do your research before investing your funds in any financial asset or presented product or event. We are not responsible for your investing results.
You can purchase Lucky Block here. Buy LBLOCK