Solana (SOL/USD) Market Pushes Down to Build Support at $30
Estimated Reading Time: 3 minutes
Don’t invest unless you’re prepared to lose all the money you invest. This is a high-risk investment and you are unlikely to be protected if something goes wrong. Take 2 minutes to learn more

Free Crypto Signals Channel
Solana Price Prediction – September 9
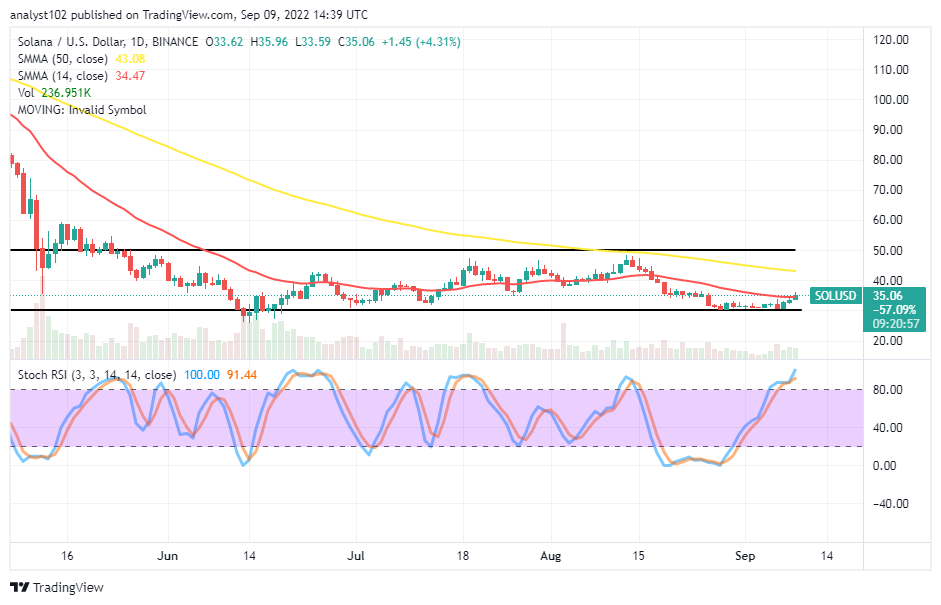
It has now been that the SOL/USD market pushes down to build support around the $30 line after a chain of range motions around the value point. In the last several hours of today’s operations, the price has been between $35.96 and $33.59 points, keeping an average percentage rate of 4.31 positive.
SOL/USD Market
Key Levels:
Resistance levels: $40, $45, $50
Support levels: $30, $25, $20
SOL/USD – Daily Chart
The SOL/USD daily chart depicts the crypto market pushing downward to build support around the $30 support level. And it is serving as the lower range point of the current trending outlook of the upper range line at the $50 resistance level. Based on the close observational techniques, all the resistance values are embodied in the range-bound spots to denote that the market can still maintain a sideways trading pattern for a while in the subsequent transactions. The Stochastic Oscillators have managed to penetrate the overbought region at the 91.44 and 100 ranges.
Can there still be more sustainable ups in the SOL/USD market operation?
Presently, the upward motions in the SOL/USD market don’t seem to bag sustainable ups as the crypto market pushes down to build support around the $30 level. Long-position takers may have to push in a consolidating effort to complete the moves to the upside averagely to the value line indicated by the trend line of the bigger SMA. The only challenge buyers would be when to detect a decent entry in the process of that assumption playing out.
On the downside of the technical analysis, the SOL/USD market sellers need the emergence of a bearish candlestick to signify the near possibility of getting a resumption of a downward move afterward. But, as it is, the market may still need to take time to get resettled underneath the trending barrier of the 50-day SMA. Short-position takers need to exercise caution. 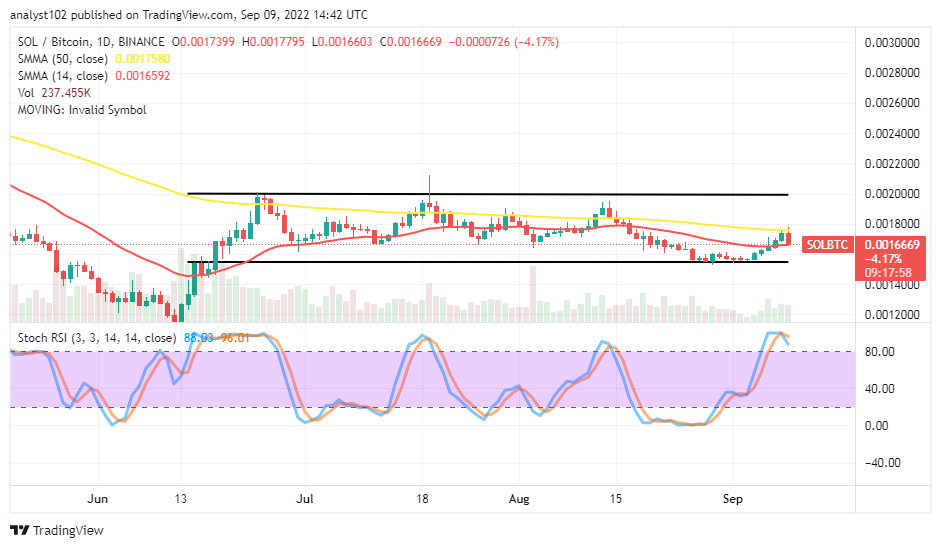
SOL/BTC Price Analysis
Solana’s trending capability, compared with Bitcoin, has been pushing in a rallying mode to hit resistance around the bigger SMA trend line. As of the time of writing, a bearish candlestick is in the making to signify that a declining force is in motion. The upper and the lower horizontal lines drew to depict that the movements either in the upward or downward direction have continually been in range-bound zones over time. The Stochastic Oscillators have moved into the overbought region, positioning at 96.01 and 88.03 range values.
Note: Cryptosignals.org is not a financial advisor. Do your research before investing your funds in any financial asset or presented product or event. We are not responsible for your investing results.
You can purchase Lucky Block here. Buy LBLOCK