Solana (SOL/USD) Price Makes a Base, Stabling Above $125
Don’t invest unless you’re prepared to lose all the money you invest. This is a high-risk investment and you are unlikely to be protected if something goes wrong. Take 2 minutes to learn more

Solana Price Prediction – April 26
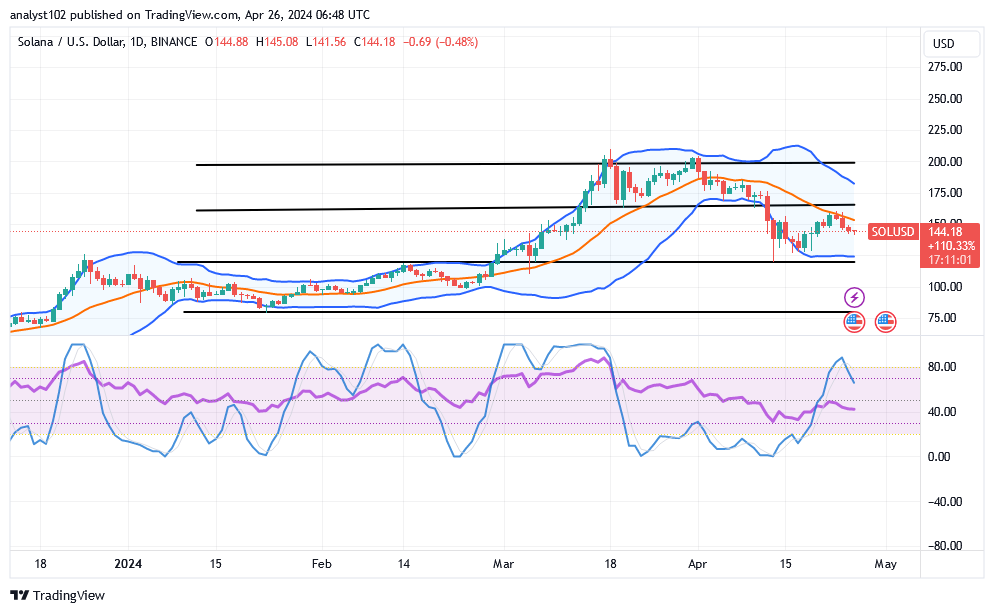
A resurface of rejections has been established around the trending pace of the middle Bollinger Band to let there be another round of corrections, given that the SOL/USD market currently makes a base, stabling above the point of $125.
According to the lower Bollinger Band indicator’s positioning stance, the $125 support line is considered to be the primary key line, meaning that any additional losses will not leave long characteristics below the value line. To allow the bulls to be ready for decent rallies, a shift in the price pattern is necessary from the stochastic oscillators’ repositioning style as they travel down to lower zones and then point back up at a specific moment.
SOL/USD Market
Key Levels:.
Resistance levels: $165, $175, $185
Support levels: $125, $120, $115
SOL/USD – Daily Chart
The SOL/USD daily chart showcases that the crypto market is making a base, stabling above $125, as depicted by the lower part of the indicators.
The stochastic oscillators are in a bent-moving mode from around the overbought region to the southbound direction, placing them around the value of 60 or hereabouts. The Bollinger Band trend lines are still tentatively bending to the downside, leaving imaginary tradable points between $200 and $125.
If the SOL/USD market were to tremble against the $125 line in the near future, what would it be?
Trembling of the SOL/USD market against the line of $125 without a quick force tending to invalidate the process would mean that bears will be gaining control for some by making sure that the lower Bollinger Band will be stretched southerly, given that the crypto-economic price makes a base, stabling above the value line.
For those that push long positions, it would be psychologically optimal to watch for any potential cryptocurrency indication to appear on a candlestick. A dependable entry will be made when a bullish candlestick begins to form and the moves begin to gain momentum.
Around $160, where the middle Bollinger Band appears to have been seeing the beginning of bearish candlesticks over the past few days, is where bears should have found an entry. However, if the subsequent decreasing force does not appear to occur, immediate shorting position instructions may be issued.
SOL/BTC Price Analysis
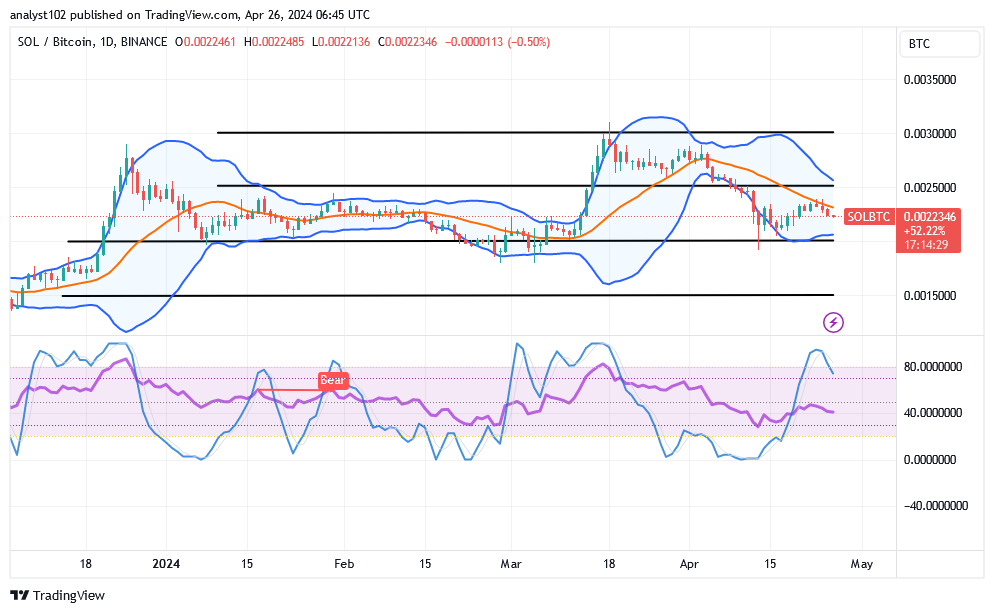
In contrast, the Solana trade is making a base versus the market valuation of Bitcoin, stabling above the lower Bollinger Band indicator.
The trend lines of the Bollinger Bands are slanting slightly southward. In an overbought region, the stochastic oscillators are in a brief southward phase. The market needs to move down a bit in order to attract strong entrants at the lower ends and generate favorable upswings.
Note: Cryptosignals.org is not a financial advisor. Do your research before investing your funds in any financial asset or presente product or event. We are not responsible for your investing results.
You can purchase Lucky Block here. Buy LBLOCK


