Solana (SOL/USD) Price Pushes Above $50 Base, Keeping Hikes
Estimated Reading Time: 3 minutes
Don’t invest unless you’re prepared to lose all the money you invest. This is a high-risk investment and you are unlikely to be protected if something goes wrong. Take 2 minutes to learn more
Solana Price Prediction – December 1
Following the process of basis-making in the market operations of Solana versus the trade worth of the US Dollar, the crypto-economic price presently pushes above the $50 base, keeping hike signals.
As of this technical piece, the capacity pace of purchasers demonstrates how company operations are positively trading around the $60.80 value line. It seems that the velocity rate has been set to move slowly and steadily in order to encourage traders who might be inclined to ride along with the upward moves at this time to place inappropriate trades. Given that supposition, buyers will probably change their positions once they tire of moving toward the resistance level of $70.
SOL/USD Market
Key Levels:.
Resistance levels:$70, $75, $80
Support levels: $50, $45, $40
SOL/USD – Daily Chart
The SOL/USD daily chart reveals the crypto-economic market pushes above the $50 base, keeping inputs toward the zone of the upper Bollinger Band.
The indicators of the Bollinger Bands are yet to be placed against the southbound pattern of the market, staying between the major trading spots of $50 and $70. The stochastic oscillators are in a positional outlook, indicating that an increasing motion is in place. If no reversal move is made to decimate today’s candle bottom, bulls will potentially push for a touch of the upper side of the Bollinger Band.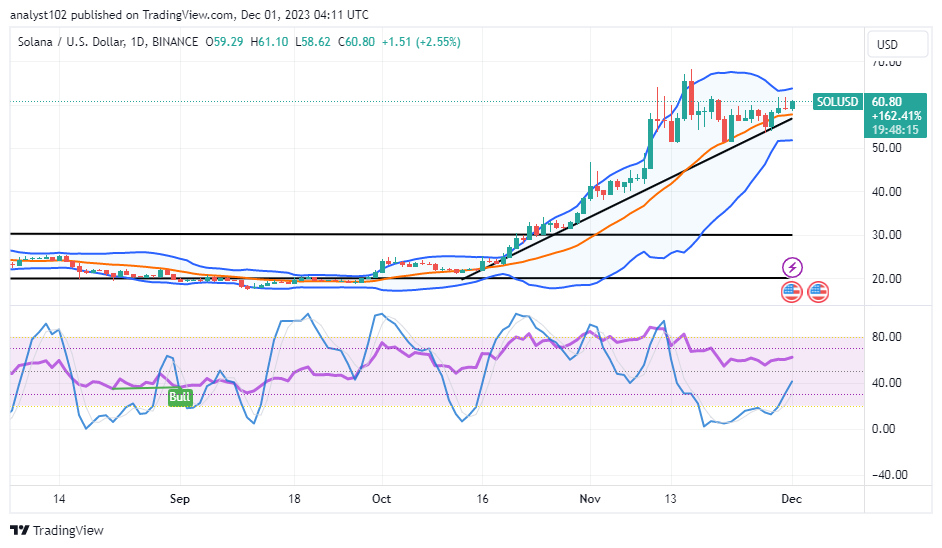
At what point will it be a better option for bears to strike in the current rising force of the SOL/USD market?
It will be a good time for sellers to begin to think of making selling orders between the positional stance of the Bollinger Band at the upper side and the resistance point of $70, coupling with active reversal moves, given the SOL/USD market presently pushes above the $50 base, keeping hikes.
It’s been shown that buyers in the market have been successful in pulling back along the bullish trend line that’s been formed to support the middle Bollinger Band. Given the current situation, bulls will lengthen their positions above the $50 line’s trading zone. For long-position placers, only longing entries would be a significant challenge.
In order to conduct a timely shorting entry, bears are advised to exercise patience and stay aware of when there may be additional volatility movements that cause the market to intentionally go upward and reach an overbought condition with rejection indicators.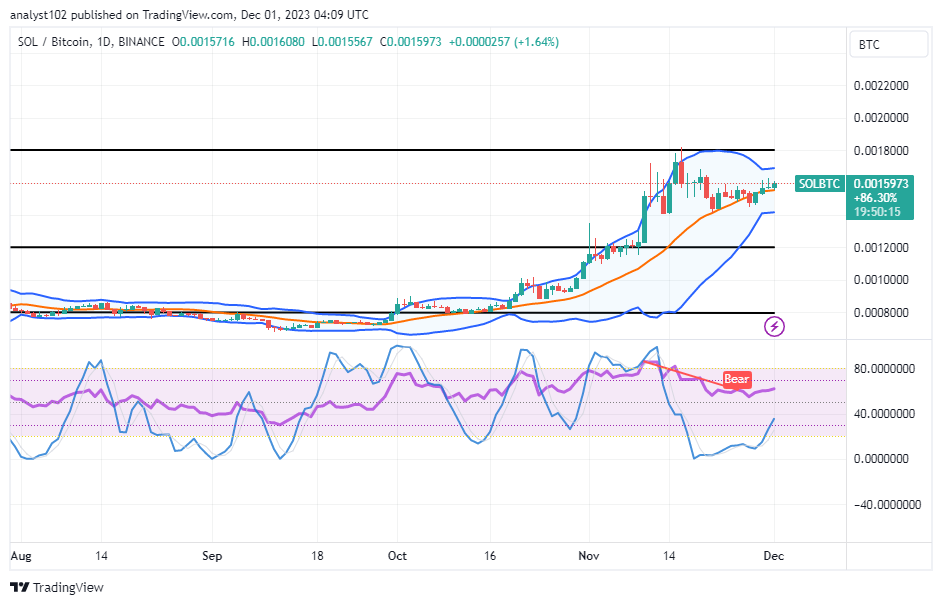
SOL/BTC Price Analysis
In contrast, the Solana trade pushes above the lower Bollinger Band against the valuation of Bitcoin, keeping hikes.
With the creation of candlesticks that have been finding support along the trend of the middle Bollinger Band, the Bollinger Band trend lines are still largely pointing north. From the oversold area, the stochastic oscillators are inclined to cross back northward and position themselves in close proximity to the 40-point. The foundational cryptocurrency might likely go into a setting in the near future.
Note: Cryptosignals.org is not a financial advisor. Do your research before investing your funds in any financial asset or presented product or event. We are not responsible for your investing results.
You can purchase Lucky Block here. Buy LBLOCK