Solana (SOL/USD) Trade Regains Energy Near Below $30
Estimated Reading Time: 3 minutes
Don’t invest unless you’re prepared to lose all the money you invest. This is a high-risk investment and you are unlikely to be protected if something goes wrong. Take 2 minutes to learn more
Solana Price Prediction – October 14
Some fall-off transactions have taken place in the SOL/USD market activities to a greater extent of breaching the $30 support line briefly to allow the crypto-trade regains its energy near below the value line. As of the time of writing, today’s session has witnessed a high and a low of $31.74 and $30.40 at an average percentage rate of 3.97 positive.
SOL/USD Market
Key Levels:
Resistance levels: $40, $45, $50
Support levels: $30, $25, $20
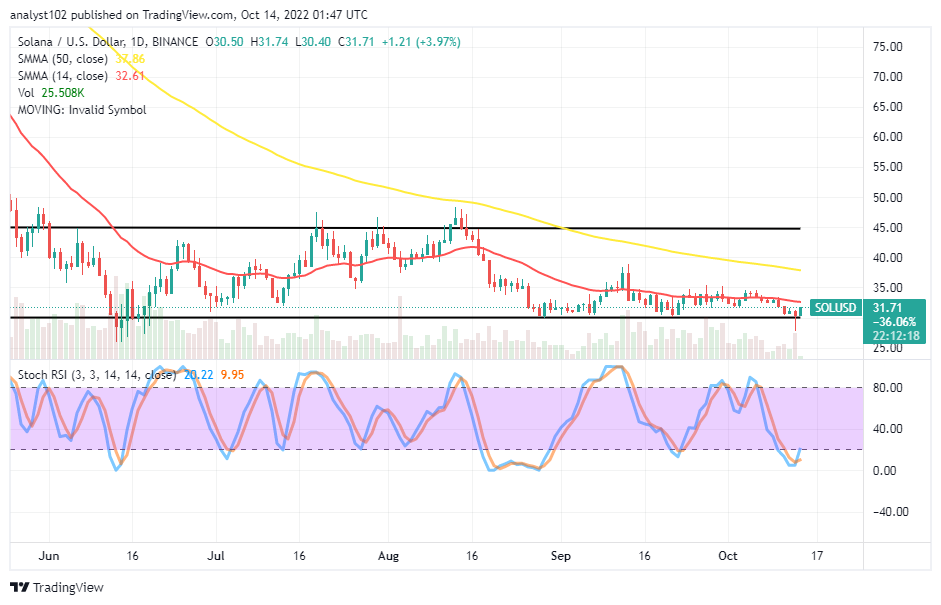
SOL/USD – Daily Chart
The SOL/USD daily chart reveals the crypto-trade regains energy near below $30 after slightly breaking it to the downside during yesterday’s transaction period. The lower horizontal line is at the marketing point beneath the trend lines of the SMAs. The 14-day SMA indicator is at $32.16, underneath the $37.86 value line of the 50-day SMA indicator. The upper horizontal line drew at the $45 resistance level to indicate the tougher-value subsequent upswings will encounter in the long run afterward. The Stochastic Oscillators have dipped into the oversold region, trying northbound from 9.95 and 20.22 range values.
What is the possible percentage that the SOL/USD market may drop from its current trading value?
At this point, the possible percentage the SOL/USD market may fall from its present trading point is about 20% as the crypto-trade regains energy near below the $30 support level. Buying outlook will likely hold firmly around the value line, as it had been in most of the past operations. Long-position placers may have to use the analytics outcome of a 1-hour time frame to determine when to exert a buy order when the price drops to an oversold region to cross back northbound afterward.
On the downside of the technical analysis, a bullish candlestick is in the making to dowse the index of the SOL/USD market bears coming back soon. The present reading position posture of the Stochastic Oscillators affirms a danger signal against getting a reliable selling position. Some sessions will have to come past before other rounds can resurface.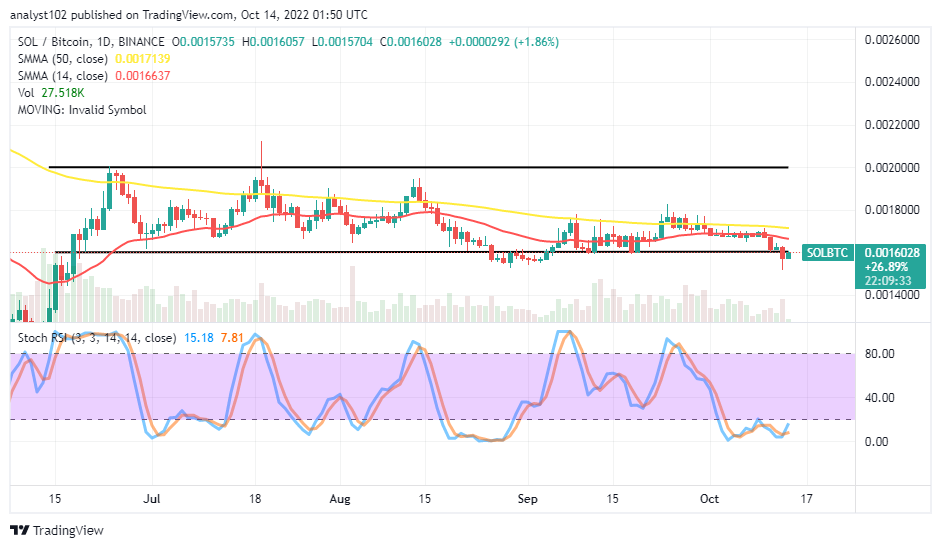
SOL/BTC Price Analysis
Solana seems to have downsized to a significant low point around the high range-trading zone to try making a swing against Bitcoin. The cryptocurrency pair trade regains energy near the trend line drawn below the SMAs. The 14-day SMA trend line is beneath the 50-day SMA trend line. The Stochastic oscillators are in the oversold region to push northbound from the 7.81 and 15.18 range values to signify the probability of the base crypto to muster momentum pairing with its counter-trading crypto.
Note: Cryptosignals.org is not a financial advisor. Do your research before investing your funds in any financial asset or presented product or event. We are not responsible for your investing results.
You can purchase Lucky Block here. Buy LBLOCK