$SPONGE (SPONGE/USD) – Bullish Momentum in Focus
Estimated Reading Time: 2 minutes
Don’t invest unless you’re prepared to lose all the money you invest. This is a high-risk investment and you are unlikely to be protected if something goes wrong. Take 2 minutes to learn more
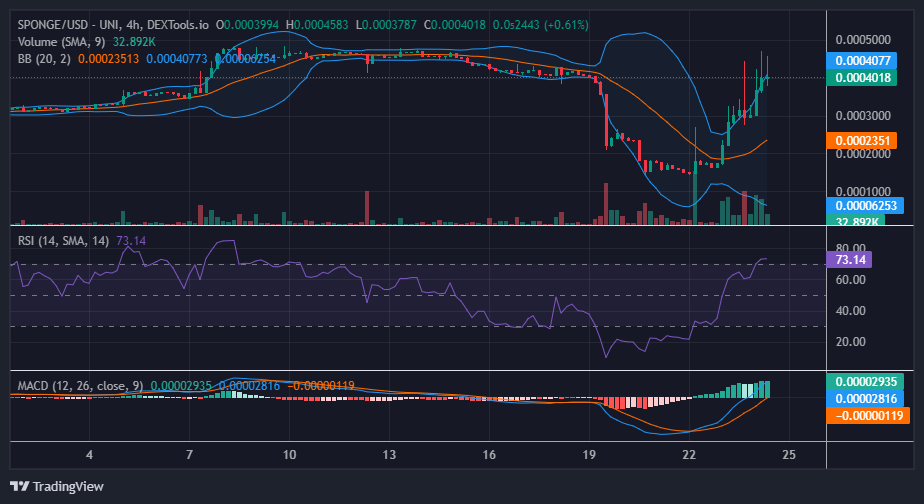
The $SPONGE pair has experienced a notable surge, with bullish traders successfully rejuvenating momentum towards the $0.00040 threshold. This analysis delves into the key technical indicators and price levels to provide insights into potential future movements of the market.
Key Price Levels:
- Resistance: $0.00047, $0.00050, and $0.00060.
- Support: $0.000350, $0.00030, and $0.00025.
The Indicators Point of View on the $SPONGE (SPONGE/USD) Market
The Bollinger Bands for $SPONGE highlight a robust bullish sentiment. The upper standard deviation curve has shown significant divergence, emphasizing the strengthening bullish momentum. Conversely, the lower deviation curve’s notable divergence was influenced by bearish activity, especially when prices approached the $0.00045 level during the 19th hour of the trading session on December 23. However, the ensuing bearish sentiment was ephemeral, as evidenced by renewed buying vigor around the $0.0003 mark, steering the market back into a bullish trajectory.
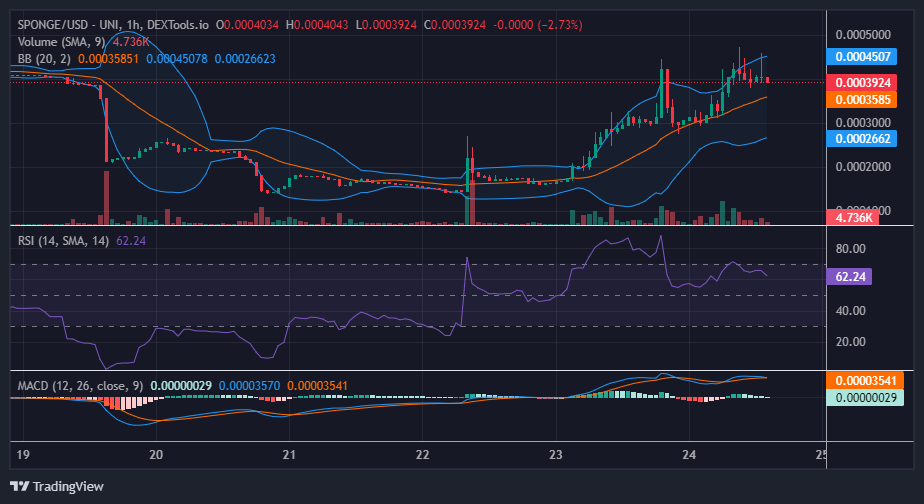
SPONGE/USD ($SPONGE) Short-term Outlook: 1-hour Chart
A pivotal support is crystallizing around the $0.00040 price point. Bulls must vigilantly defend this level against any downward pressures; breaching it might jeopardize the prevailing upward momentum. Currently, both the Bollinger Bands and the Relative Strength Index (RSI) on the 1-hour chart align with bullish tendencies. This convergence implies that bulls might continue to exert influence over market dynamics. Nevertheless, a period of consolidation around the present price level is anticipated before any sustained upward movement.
In conclusion, while short-term indicators lean bullish, traders should monitor key resistance and support levels for potential breakout or retracement scenarios.
SPONGE/USD is about to blow! Buy now!
You aint seen nothing yet 😎$SPONGE #BullMarket #AltSeason pic.twitter.com/lqWV8VLFrh
— $SPONGE (@spongeoneth) December 23, 2023
Invest in the hottest and best meme coin. Buy Sponge ($SPONGE) today!