Synthetix (SNXUSD) Bulls Have Laid a Siege Below the $9.300 Resistance
Estimated Reading Time: 3 minutes
Don’t invest unless you’re prepared to lose all the money you invest. This is a high-risk investment and you are unlikely to be protected if something goes wrong. Take 2 minutes to learn more
Synthetix Analysis – The $9.300 Resistance Remains Under Siege From the Bulls
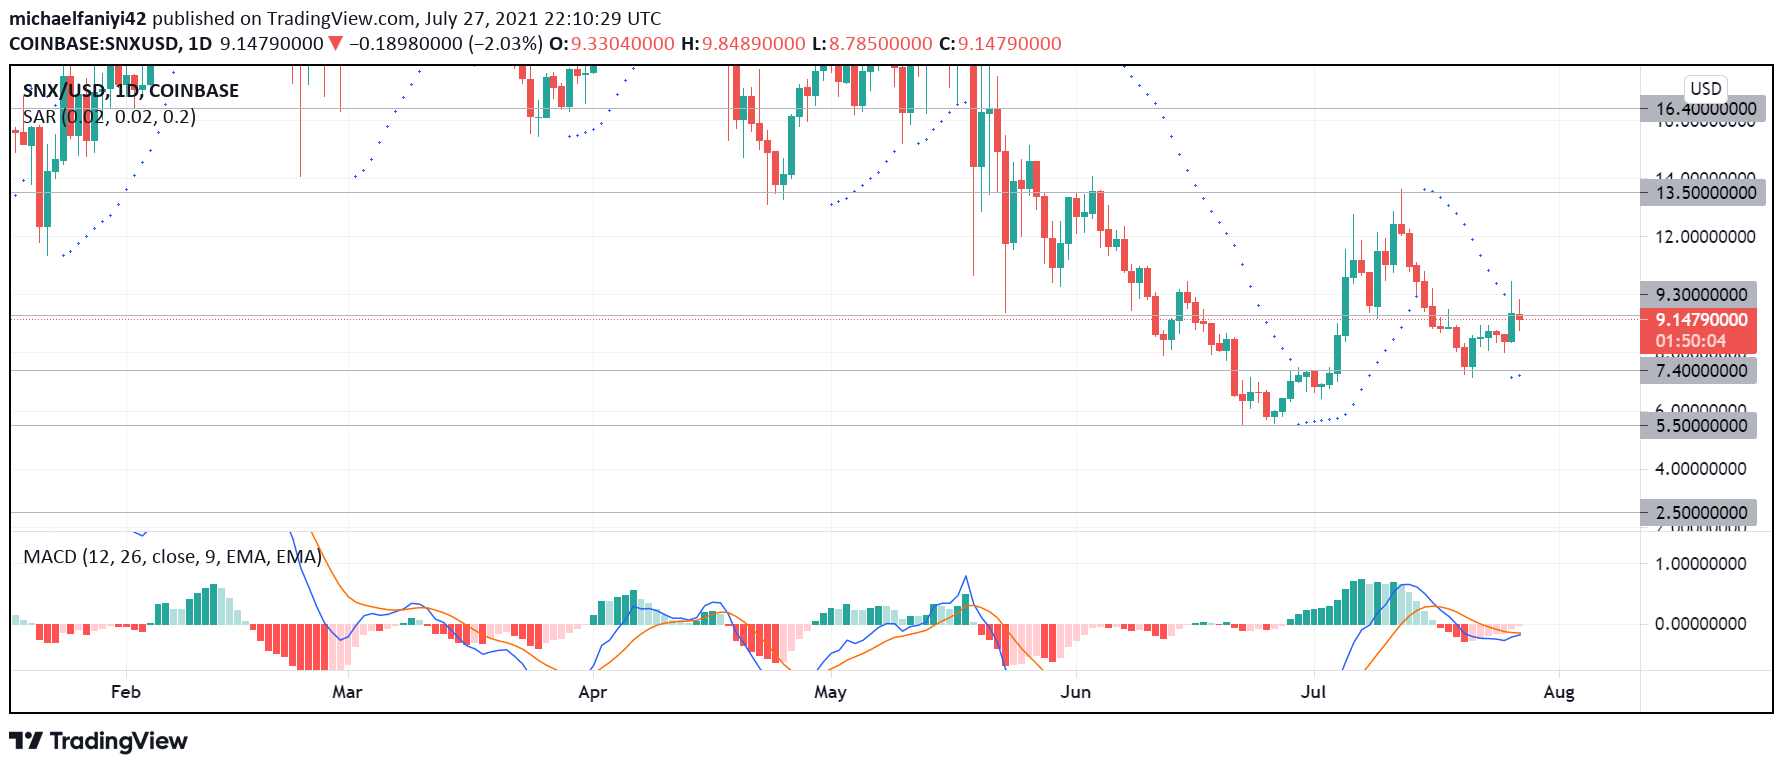
Synthetix bulls are aiming to break through the $9.300 barrier again and have laid a siege below it. Bears initially plunged the market below $9.300 on the 16th of June 2021, to which it fell directly to support at $5.500. Price rallied from there but found resistance at $7.400. Bulls laid a siege on it that lasted for seven days before the coin broke through. Afterward, price shot up, easily bypassing $9.600.
Synthetix Key Levels
Resistance Levels: $9.600, $13.500, $16.400
Support Levels: $2.500, $5.500, $7.400
The coin went higher to test the $13.500 resistance, but the price failed at this level. After two attempts, bulls weakened and allowed bears to bring down the market below $9.300 again. This time around, Synthetix halted its fall at $7.400 and immediately started punching upwards. There has, however, been very strong resistance at $9.600. It has prevented the market from going up. Bulls have thus far laid a siege below it for the past six days.
Currently, Synthetix is showing a Doji candlestick, which shows indecision. The coin is set to pass out today also below the $9.300 resistance. The Parabolic SAR (Stop and Reverse) has two dots below the daily candles to show the market’s bullish intent. This is also the situation with the MACD (Moving Average Convergence Divergence). Its signal lines are hovering under the zero level. This is accompanied by reducing bearish histogram bars.

Market Anticipation
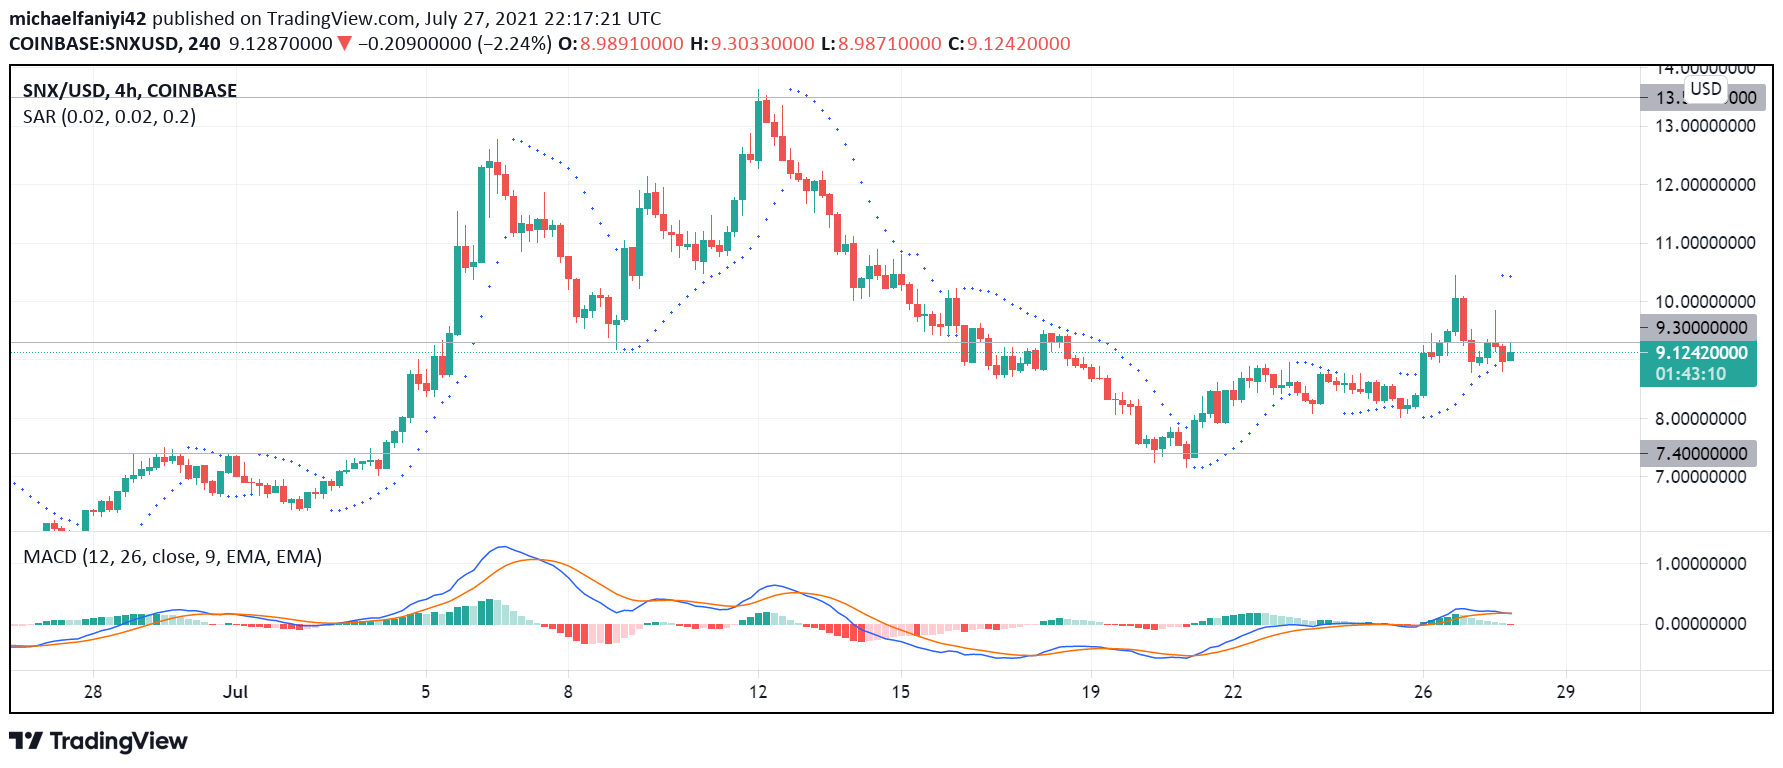
The 4-hour chart reveals that price had a false break out from the $9.300 resistance before returning below. The key level has thus far defended the market. Currently, the Parabolic SAR has its dots above the candles. The MACD also shows its signal line about to cross and go lower. A single bearish histogram bar has also been formed.
Indications are that bulls will eventually weaken and the price will fall towards the $7.400 support and shoot up for a retest.
You can purchase crypto coins here. Buy Tokens
Note: Cryptosignal.org is not a financial advisor. Do your research before investing your funds in any financial asset or presented product or event. We are not responsible for your investing results.