Synthetix (SNXUSD) Fails to Break Out and Instead Breaks Down
Estimated Reading Time: 3 minutes
Don’t invest unless you’re prepared to lose all the money you invest. This is a high-risk investment and you are unlikely to be protected if something goes wrong. Take 2 minutes to learn more
SNXUSD Analysis – Price Breaks Down After It Fails to Break Out
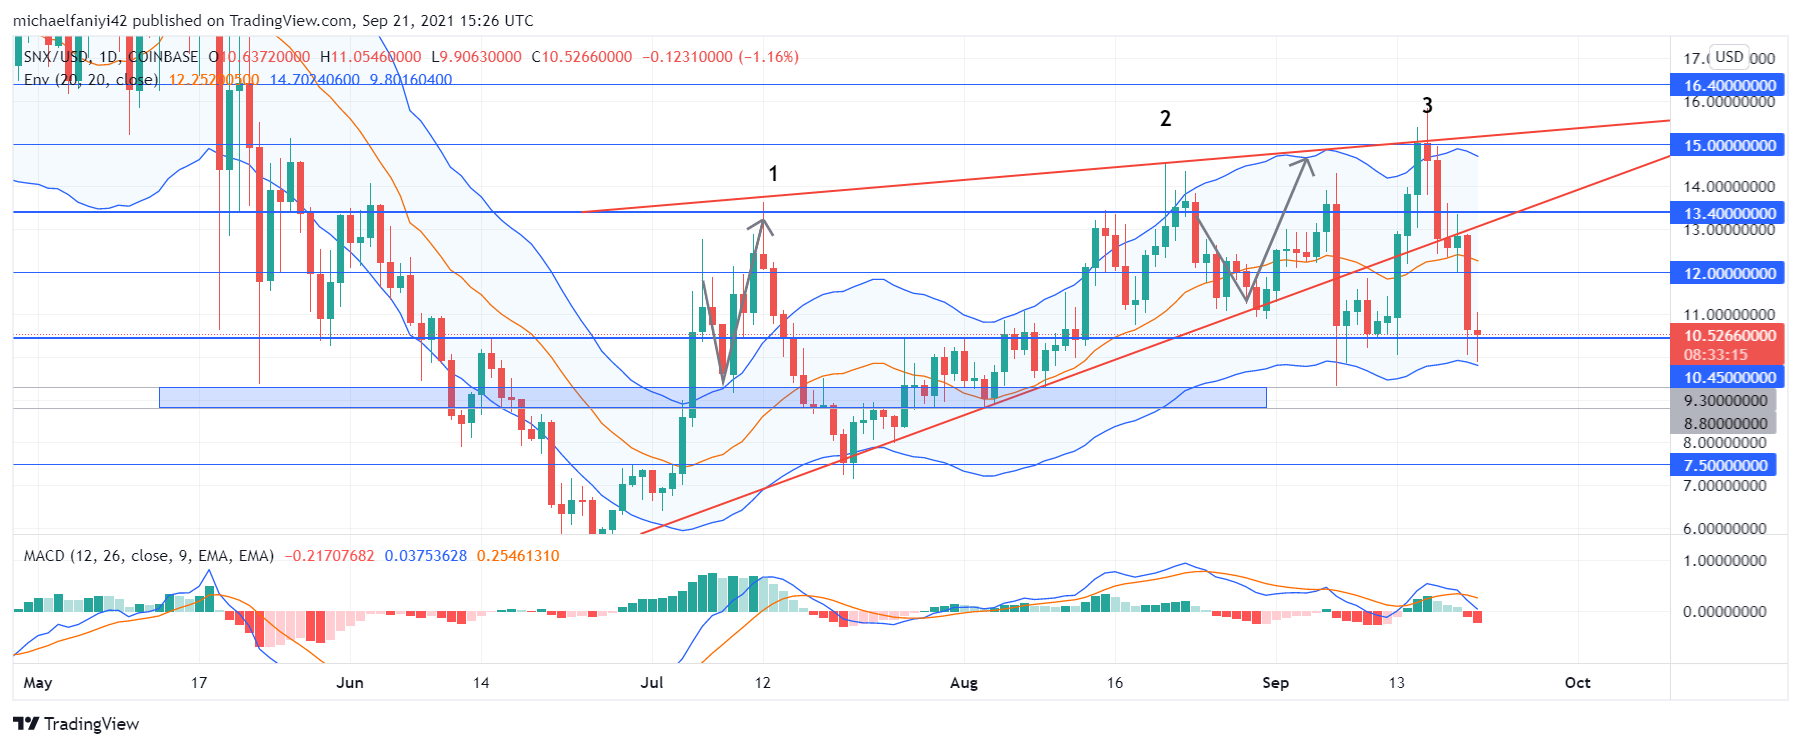
SNXUSD fails to break out past the upper border of its ascending triangle formation. This has led to a total breakdown in price in which the market falls back to $10.450. This comes as a setback for the market, which has been trying to recover for several weeks after hitting rock bottom at $5.500 on the 22nd of June 2021. The market has now broken down and out of the triangle pattern, and it is up to the market to pick itself up again.
SNXUSD Critical Zones
Resistance Zones: $12.000, $13.400, $15.000
Support Zones: $10.450, $7.500, $5.500
The coin began its recovery from $5.500 by leaping to $13.400, but the market strength was too weak to violate the resistance, hence price dropped to $10.450, where it gradually kept climbing upwards. Next, on the 14th of August, the market launched a double assault on the $13.400 zone again, without success. The third time was on the 5th of September. This time, the coin was knocked out as it slumped out of its triangle pattern to a level below $10.450.
After a week of recovery, having been empowered by the $10.4590 support, SNXUSD threw all its power to break through $13.400. It was successful, but upon reaching the next resistance at $15.000, the bulls were exhausted and all progress was undone as the coin dropped precipitously back to $10.450. SNXUSD has dropped to the lower line of the Envelope indicator. It remains to be seen if the lower line of the Envelope will be strong enough to hold the market from further drawdown.

Market Anticipation
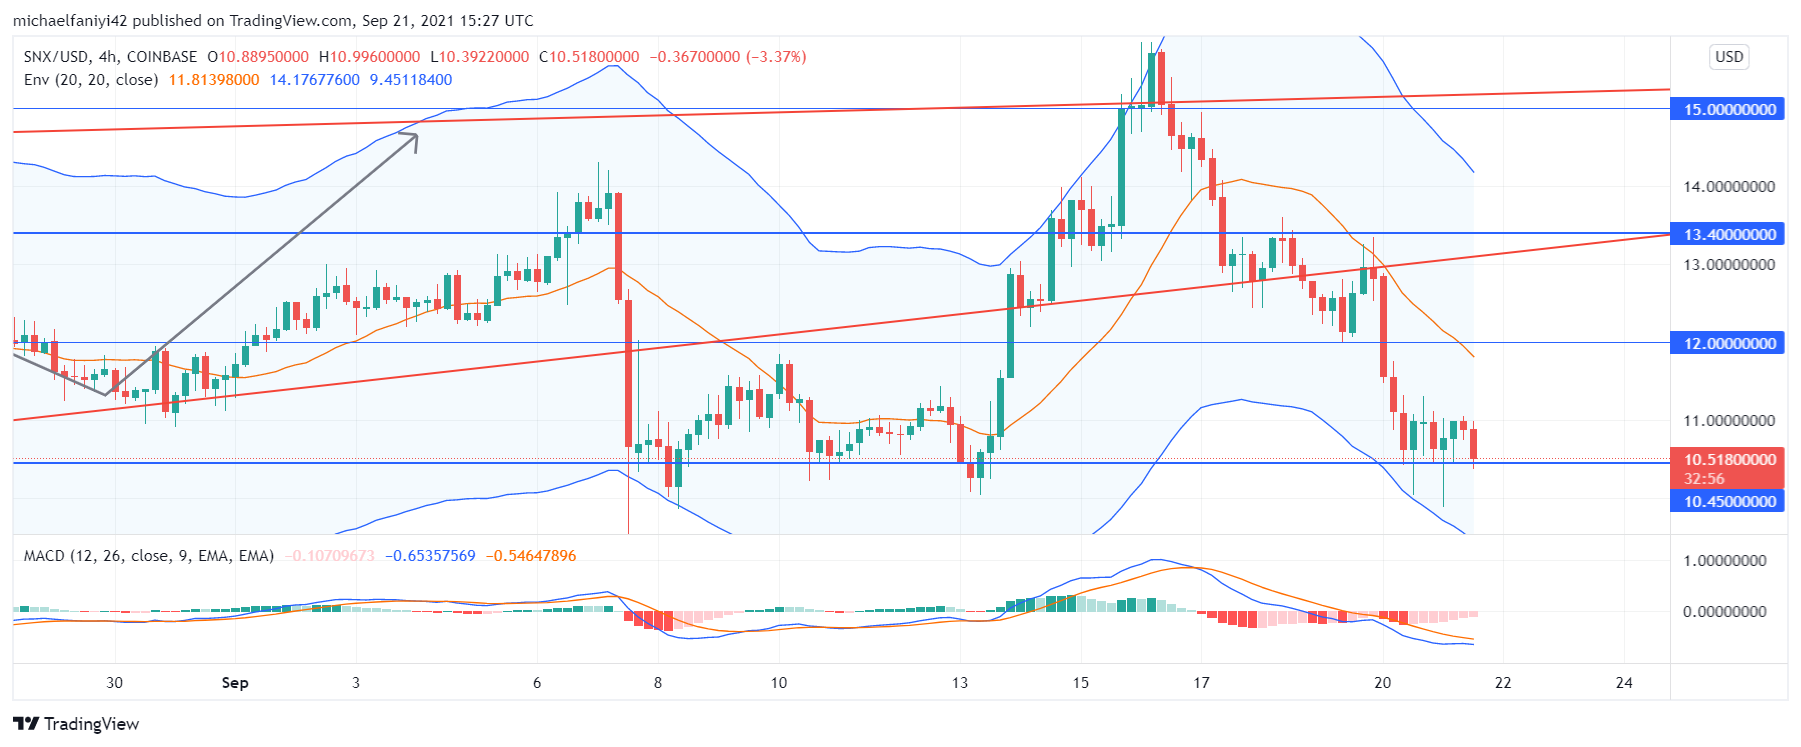
On the 4-hour chart, price is regaining its footing and avoiding further decline by leveraging the double support provided by the $10.450 key level and the lower border of the Envelope indicator. A combination of several reversal candlesticks suggests that the price decline may have halted and the bulls are ready to rally again. The Moving Average Convergence Divergence (MACD) indicator has its lines about to cross each other upwards. This is accompanied by reducing bearish histogram bars.
A price reversal is imminent, which will lift the coin to $13.400 before further reactions.
You can purchase crypto coins here: Buy Tokens
Note: Cryptosignals.org is not a financial advisor. Do your research before investing your funds in any financial asset or presented product or event. We are not responsible for your investing results.