Synthetix (SNXUSD) Falls at Daily Resistance Level
Estimated Reading Time: 2 minutes
Don’t invest unless you’re prepared to lose all the money you invest. This is a high-risk investment and you are unlikely to be protected if something goes wrong. Take 2 minutes to learn more
SNXUSD Price Analysis – Price Falls at Daily Resistance Level
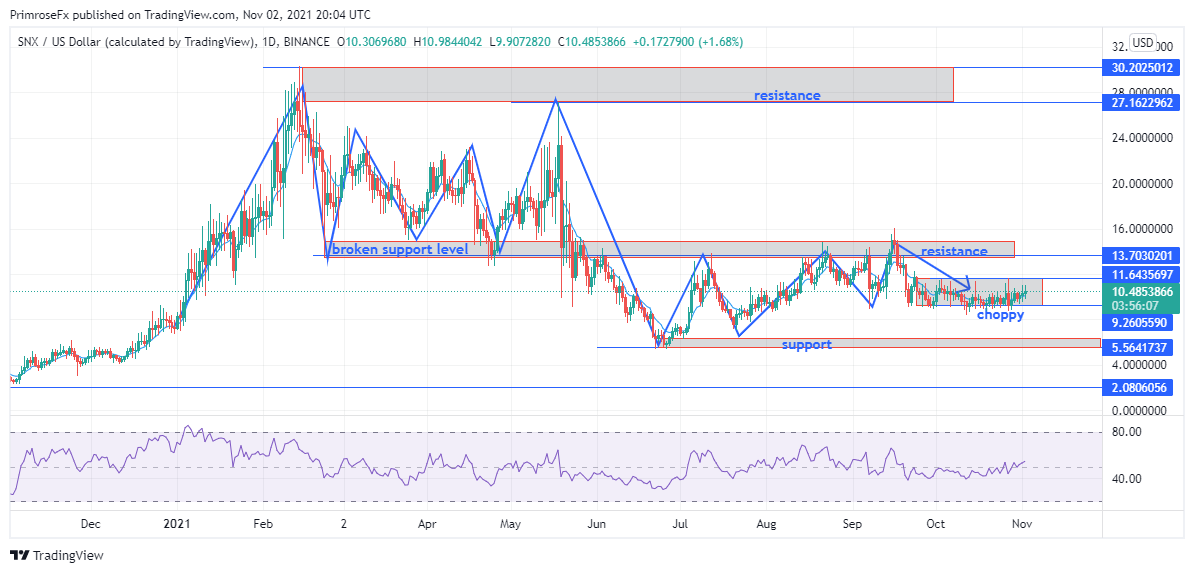
SNXUSD price falls after it enters the month of January. After that, a strong bullish candle can be seen, leaving the price to rise till February. This makes the market hit its all-time high level at 30.200.
SNXUSD Critical Zones
Resistance Levels: $30.200, $13.700
Support Levels: $13.700, $5.560
SNXUSD hit its all-time high of $30.200 on the 14th of February. Immediately after this, the price falls back to the support level of $13.640. The price pulled back to retest the resistance level, which is the all-time high market price level. This leaves the price at the $27.160 price level until the sellers force the price to fall from this level.
The sellers were seen to gain high momentum as the price breaks the support level of $13.700. The price continues to fall till it got caught at the support level of $5.560. After this massive fall in SNXUSD, price went up to hit the previous support level of $13.700, but at this level, the price was rejected by the sellers and they drove the price down. Price has tested this previous support of $13.700 about three times, and price has been rejected each time. This shows that the market has used this level as a resistance level.

Market Predictions
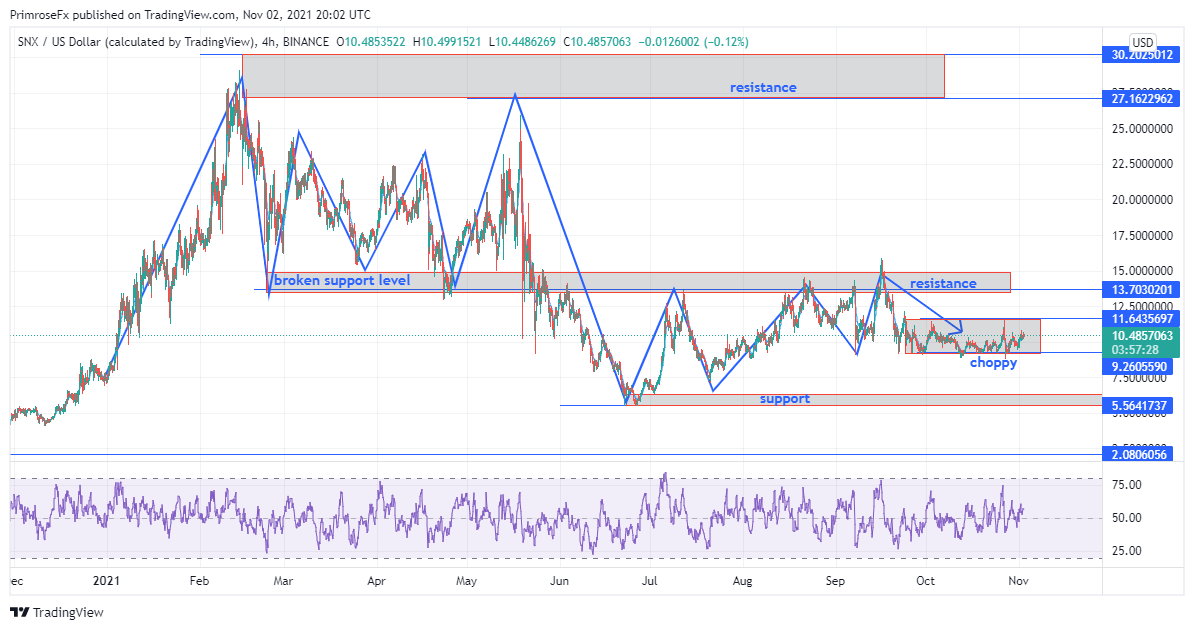
In the 4hr timeframe, the price was seen to be ranging between the support level of $5.560 and the resistance level of $13.700. In between this support and resistance level, the price was found to be choppy between the price level of $11.640 and $9.260. This signifies an insignificant market trend as the market is presently on accumulation.
The Moving Average period 9 (MA) is viewed under the candlesticks with consecutive short bullish candles. This might indicate an accumulation from the end of the buyer to break the resistance level to be able to push the price up. The Relative Strength Index (RSI) was found to be ranging around the 50% level.
You can purchase crypto coins here: Buy Tokens
Note: Cryptosignals.org is not a financial advisor. Do your research before investing your funds in any financial asset or presented product or event. We are not responsible for your investing results.