Synthetix (SNXUSD) Is Approaching a Key Support Level
Don’t invest unless you’re prepared to lose all the money you invest. This is a high-risk investment and you are unlikely to be protected if something goes wrong. Take 2 minutes to learn more

Free Crypto Signals Channel
SNXUSD Analysis – The Market Is Approaching a Key Support Level at $3.60
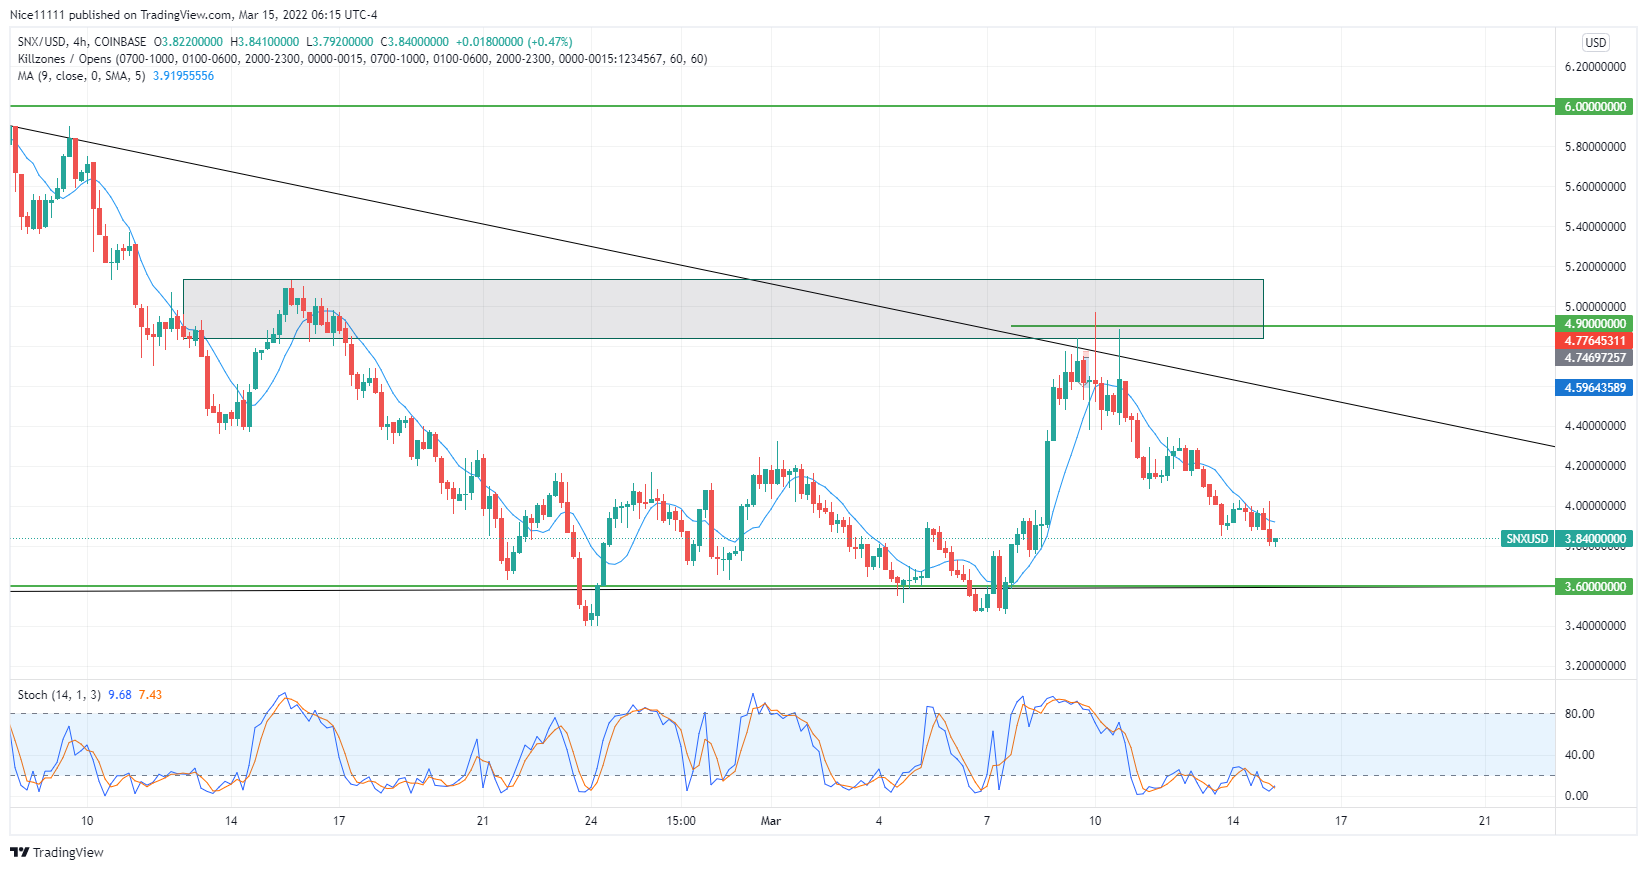
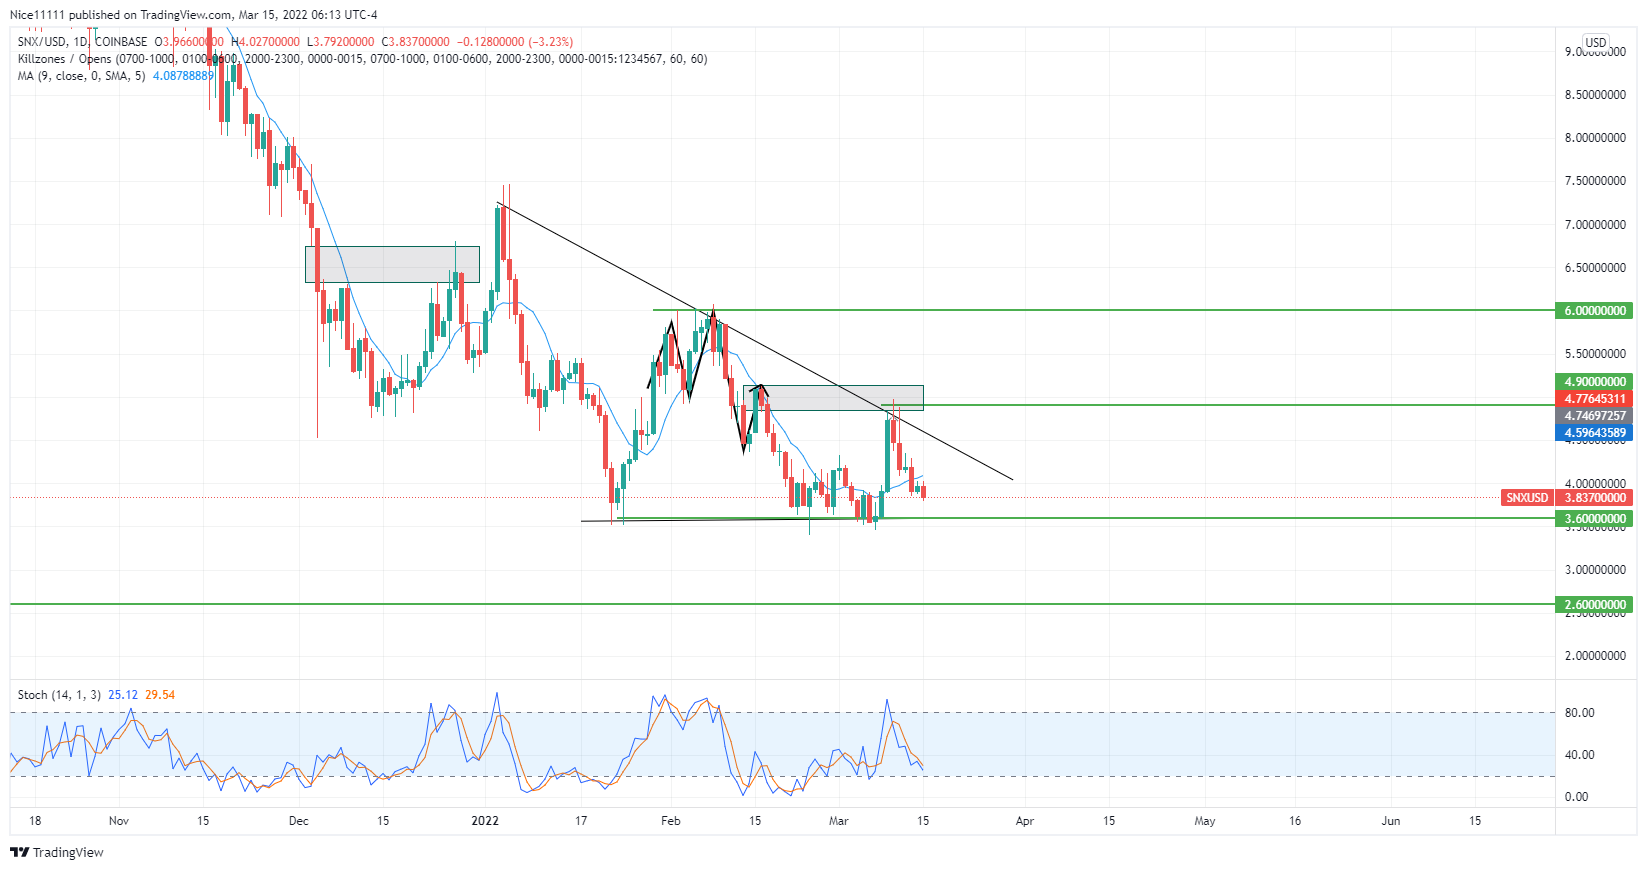
SNXUSD is approaching a key support level at $3.60. The overall market is bearish. On the daily chart, lower highs and equal lows have formed. A descending triangle pattern has formed, obviously on the daily timeframe. On the 27th of December, the market rose to fill up the last gap in the downtrend. After the gap was filled, another high was created afterwards.
SNXUSD Key Levels
Support level: $2.60, $3.60
Resistance level: $4.90, $6.00
The new high seemed to indicate a bullish trend was ready to continue. The Stochastic indicator was there to tell traders that the market was already overbought. The bulls’ run was paused with the daily high on the 4th of January. This was followed by a severe crash as the market was approaching a fundamental support level at $3.60. The market eventually reached the demand zone at $3.60. The demand zone was well defended; hence, the bears did not pull through.
The bulls utilized the opportunity to go long away from the key support level. They were stopped at the $6.00 resistance zone. The Moving Average period nine switched its position to rest above the daily candles on the eleventh of February. There was a break in the market structure formed by a double top. The neckline was tested on the 16th of February. This was followed by bearish pressure, which led the market back to $3.60.

Market Expectation
The market eventually bounced to the downward trend line bordering the candles from above. The supply zone at $4.90 was reached on the 9th of this month. The Stochastic indicator was already overbought. This led to a selloff in the market. The market is approaching a key support level at $3.60. The Moving Average is currently resting above the four-hour candles. This is likely to sink the market to $3.60 finally.
How To Buy Lucky Block
Note: Cryptosignals.org is not a financial advisor. Do your research before investing your funds in any financial asset or presented product or event. We are not responsible for your investing results.
