Synthetix (SNXUSD) Is Trapped, to Slide Down a Descending Channel
Estimated Reading Time: 3 minutes
Don’t invest unless you’re prepared to lose all the money you invest. This is a high-risk investment and you are unlikely to be protected if something goes wrong. Take 2 minutes to learn more
SNXUSD Analysis – Price Is Trapped in a Downtrend
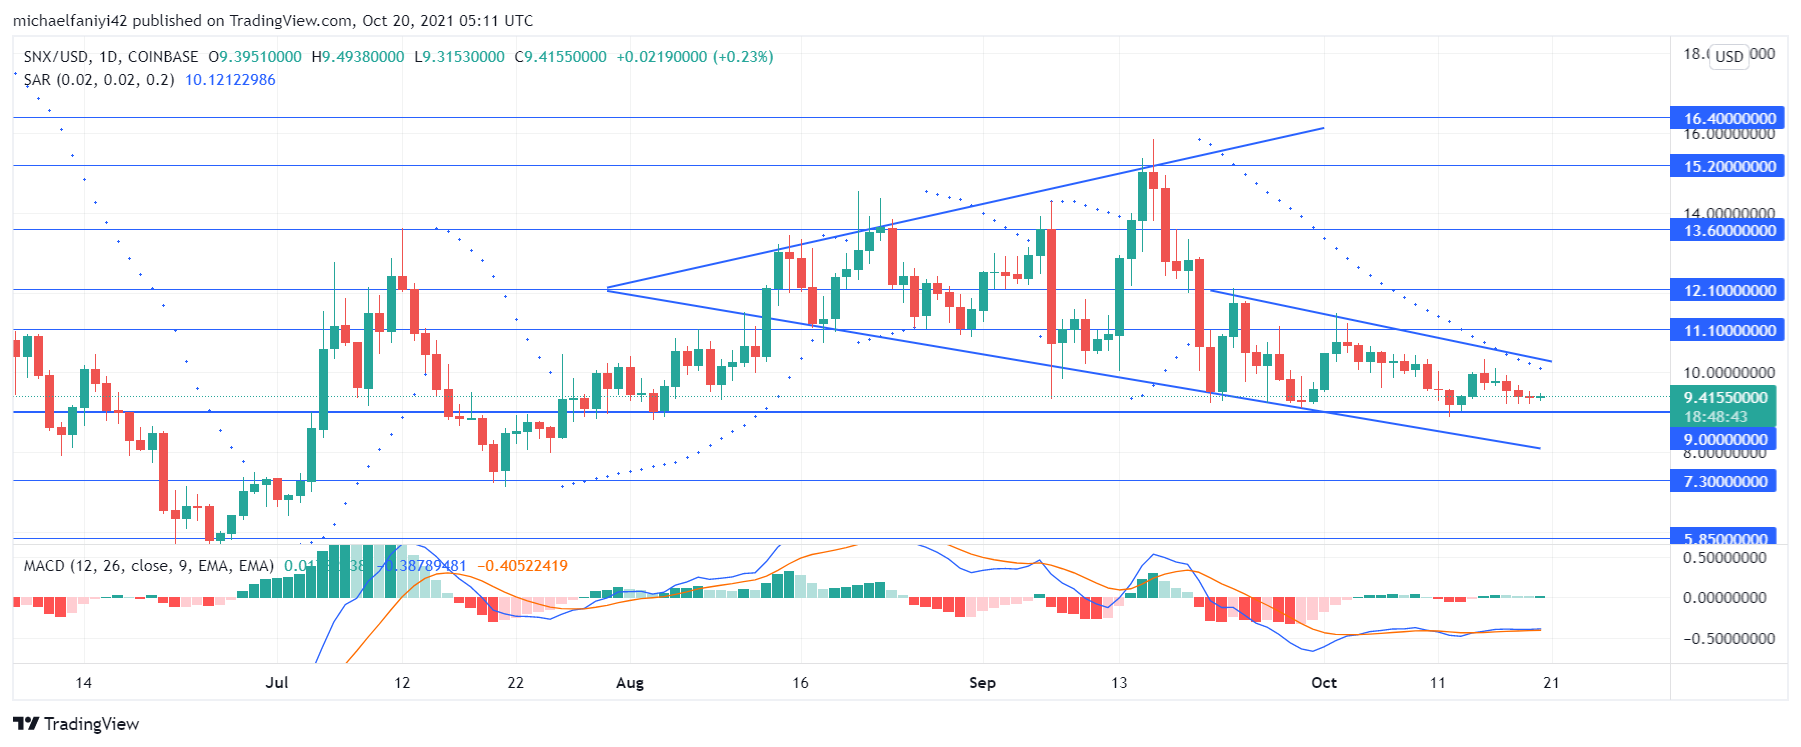
SNXUSD is trapped below the $12.100 resistance level and begins a slide down a descending channel. The inability of the coin to subdue the $12.100 key level ensures that the price begins dropping, making consecutive lower highs. However, the market remains on the same support as the $9.000 key level refuses to bulge. This has led to a tapering movement of the market between the support and the upper border of the descending channel.
Significant Levels of the SNXUSD
Resistance Levels: $11.100, $12.100, $15.200
Support Levels: $5.850, $7.300, $9.000
SNX has been making efforts to rally from the 26th of June after it reached rock bottom at $5.850. The rally process of the market, except for a couple of spikes, was pretty straightforward and gradual. Price is seen making consecutive higher highs and lows. This continued till the market met a solid barrier at $13.600. Thereafter, the structure of the market was altered and the coin began to move in an expanding wavy manner.
SNXUSD eventually breaks through the $13.600 barrier, but at the cost of dropping lower to around the $9.000 support level. Price was then trapped by the $12.100 resistance level and couldn’t go higher. This has led to a tapering movement from the market as the coin is trapped in a downtrend. The Parabolic SAR (Stop and Reverse) shows long consecutive dots above the market to emphasize sellers’ effect. The coin is tapering downward and we expect to see a break out to the upside.

Market Predictions
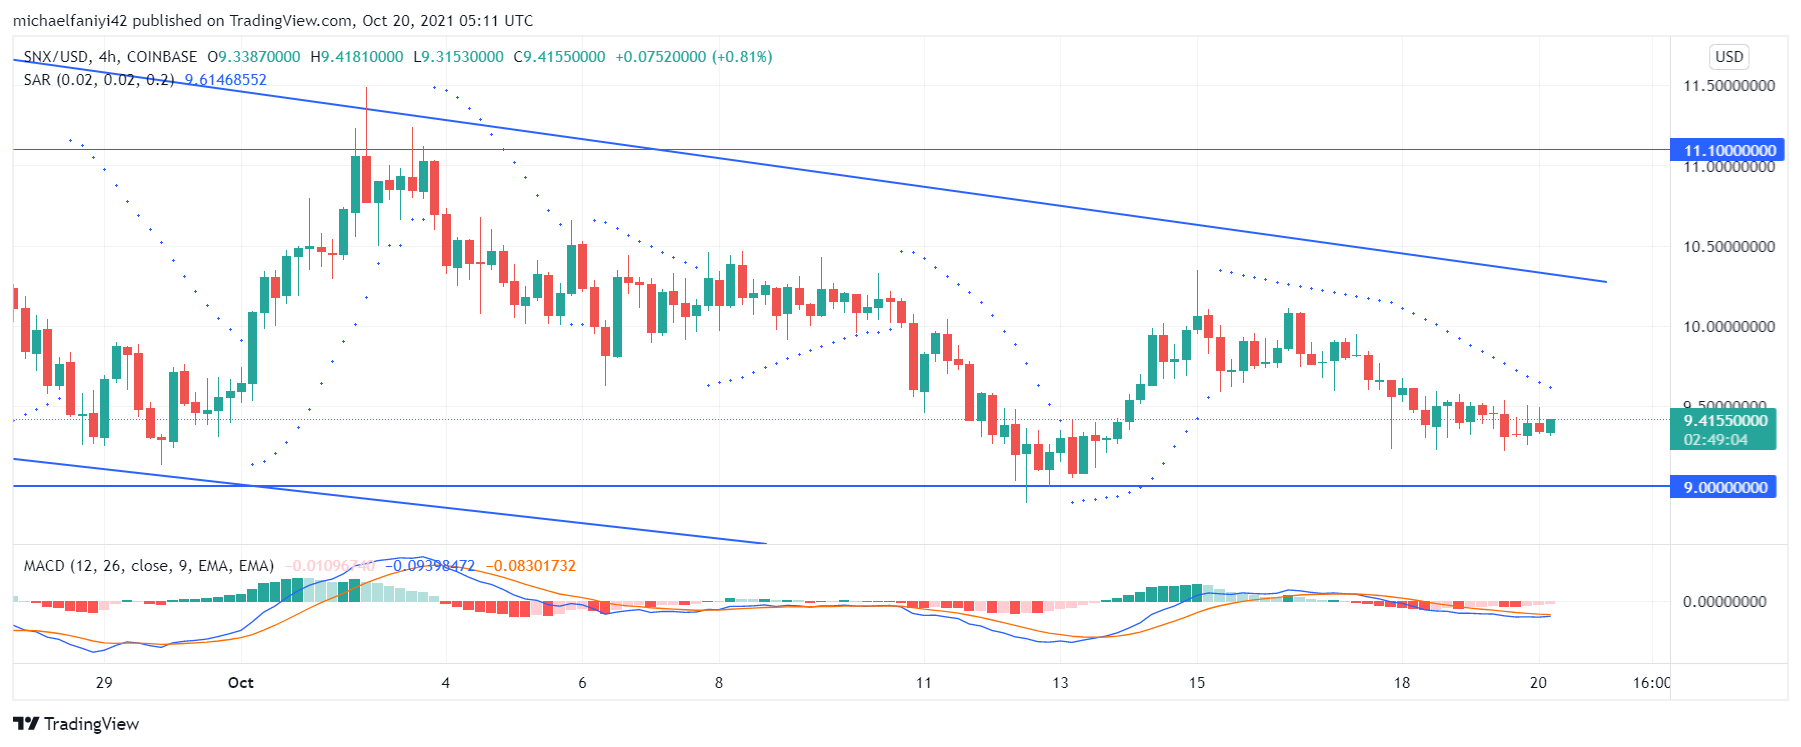
On the 4-hour chart, a triangle formation can be perceived in the market. The market keeps tapering through it. The MACD (Moving Average Convergence Divergence) is showing an alternation of bearish and bullish histogram bars. Currently, the market is still portrayed as bearish, meaning that the price will remain trapped within the triangle, tapering downward, till it breaks out. SNXUSD will be looking to test the $12.100 resistance when it breaks out.
You can purchase crypto coins here: Buy Tokens
Note: Cryptosignals.org is not a financial advisor. Do your research before investing your funds in any financial asset or presented product or event. We are not responsible for your investing results.