Tamadoge (TAMAUSD) Market Stability Extends Into the Weekend
Estimated Reading Time: 2 minutes
Don’t invest unless you’re prepared to lose all the money you invest. This is a high-risk investment and you are unlikely to be protected if something goes wrong. Take 2 minutes to learn more

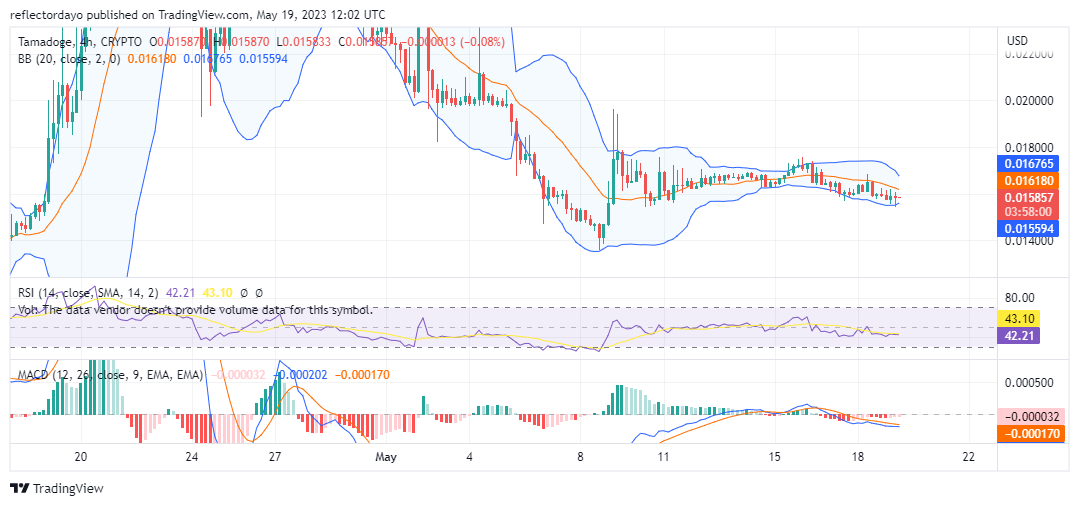
Tamadoge has maintained a stable market for the past nine days. Between May 14 and May 16, the price channel grew very narrow. Traders and analysts anticipated this to come before a decisive movement of the market in a distinct direction. As expected, we should have seen this breakout on May 15. In fact, there was a bit of what we could refer to as a bullish price breakout. Increasing bullish sentiment at the $0.0162 price level propelled the market to the upside on May 15. But the uptrend was terminated at $0.0175, and since then, the market has fallen back into an indecision trend.
Key Levels
- Resistance: $0.035, $0.040, and $0.045
- Support: $0.015, $0.014, and $0.013
(TAMAUSD) Price Analysis: The Indicators’ Point of View
At this point in time, what the market needs is a bit of an increase in the volume of trade. The increased volume of trade will affect market volatility. In a volatile market, bulls and bears have an equal chance to drive the market in their favor. For the past three days, in the Relative Strength Index (RSI), the market’s momentum has continued to move along the 41.94 level. Although the selling momentum is on the moderate side, we are not seeing any exciting moves yet.
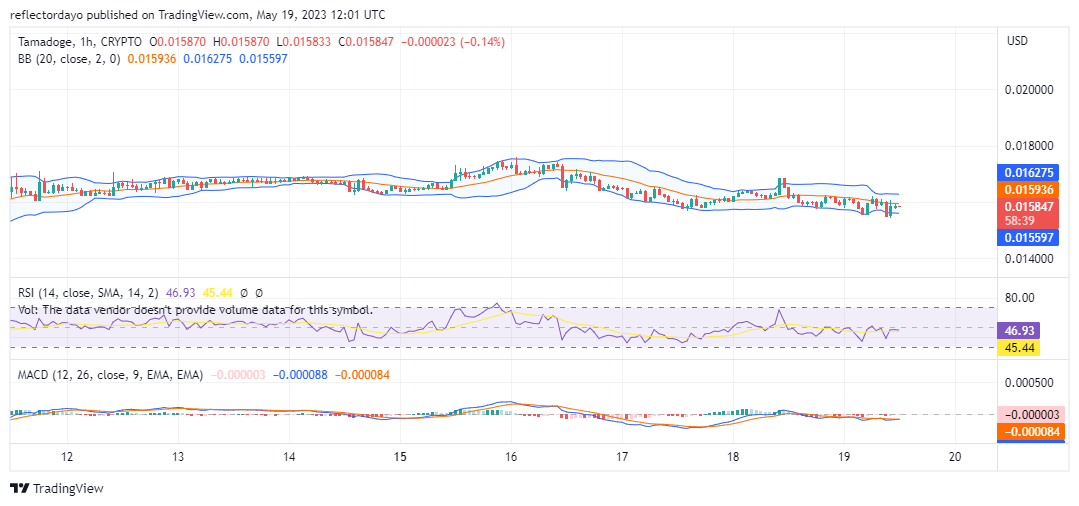
TAMA/USD Short-Term Outlook: 1-Hour Chart
The Bollinger Bands indicator and the Relative Strength Index (RSI) portray the market at equilibrium. But the stochastic RSI portrays the market slightly above the midpoint. In addition to that, the faster curve is recoiling. This backed up the sentiment of the other two indicators. The stochastic RSI is very good at spotting a potential distinct trend before it breaks out, which is why it measures a bit higher above the midpoint. However, it later supported the sentiments of the other indicator as its curve recoiled. More traders are needed to enter long positions. This might revive the market again.
Take part in the weekend Tamadoge play-to-earn game.
We have a feeling this stat is going to be outdated very soon 😉
Give your weekend a boost in the Tamadoge Arcade 👉 https://t.co/IWYl78XAUy pic.twitter.com/VhldryR0R9
— TAMADOGE (@Tamadogecoin) May 19, 2023
Do you want a coin that will be 100 times more valuable in the next few months? That is Tamadoge. Buy TAMA today!