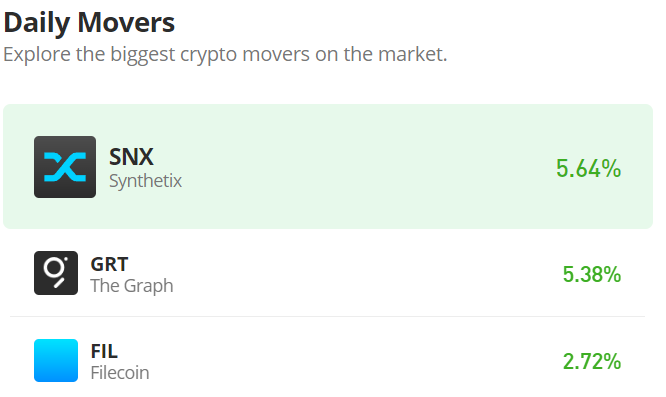
The Graph (GRTUSD) Price Breaks the Supply Line
Estimated Reading Time: 3 minutes
Don’t invest unless you’re prepared to lose all the money you invest. This is a high-risk investment and you are unlikely to be protected if something goes wrong. Take 2 minutes to learn more
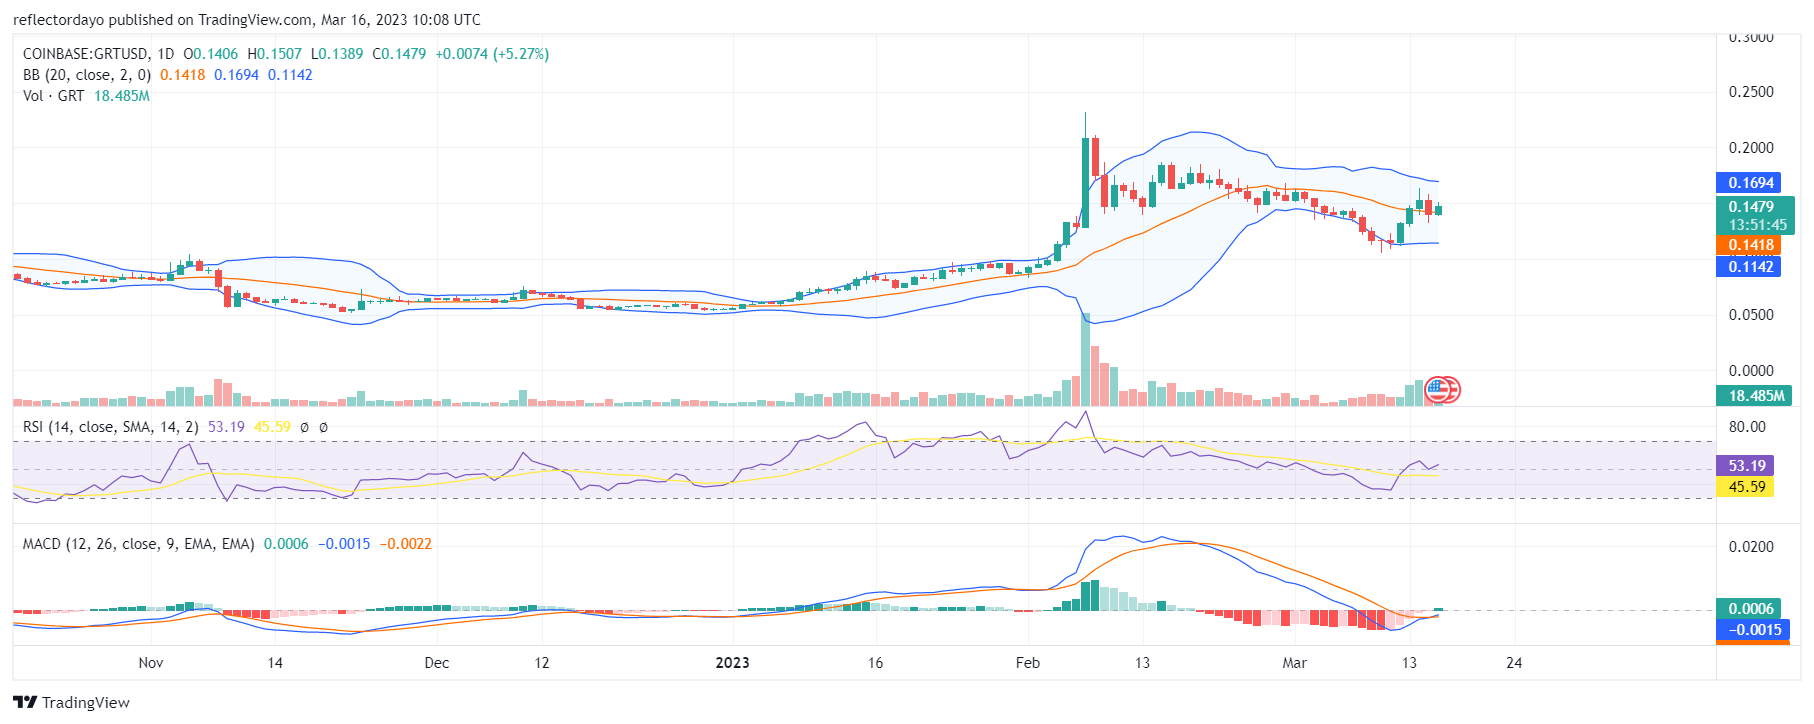
On February 7, the Graph price pumped furiously, taking the market to a high of $0.2312. The Graph buyer could not sustain the price at that level as they became exhausted, and the bear market was triggered. The market turned to the south, with very strong momentum. One would have thought that the downtrend would make the price fall below the previous support level of $0.128 but the price was preserved at the $0.15 price level. This higher support is a pointer to the fact that the bulls are still in the game. However, between the second half of February and early March, the market consolidated around this price level. This made the bearish pressure build up, and eventually, $0.15 became the new supply level.
GRT/USD Price Statistics
- GRT/USD Price Now: $0.148
- GRT/USD Market Cap: 1,367,079,281
- GRT /USD Circulating Supply: 8,839,655,701 GRT
- GRT/USD Total Supply: 10,607,470,682
- GRT/USD Coin Market Cap rank: #41
Key Levels
- Resistance: $0.16, $0.17, and $0.18
- Support: $0.11, $0.10, and $0.09
Price Prediction for the Graph: The Indicators’ Point of View
The buyers were forced to find a new price zone at $0.1123. From here, the market is bouncing back but is now dealing with the roadblock at the $0.15 price level. We can expect the re-capture of this key price level because the three consecutive bullish candles are significant indicators of strong bullish activity in the market. The market, from the point of view of the indicators, has crossed into the buy zone. This means that buyers are regaining their grip on the market. However, some traders are willing to short their positions around this price level, and that is why another possibility for the market may be to go flat around this level for a short while before the bull market is established above the $0.15 price level.
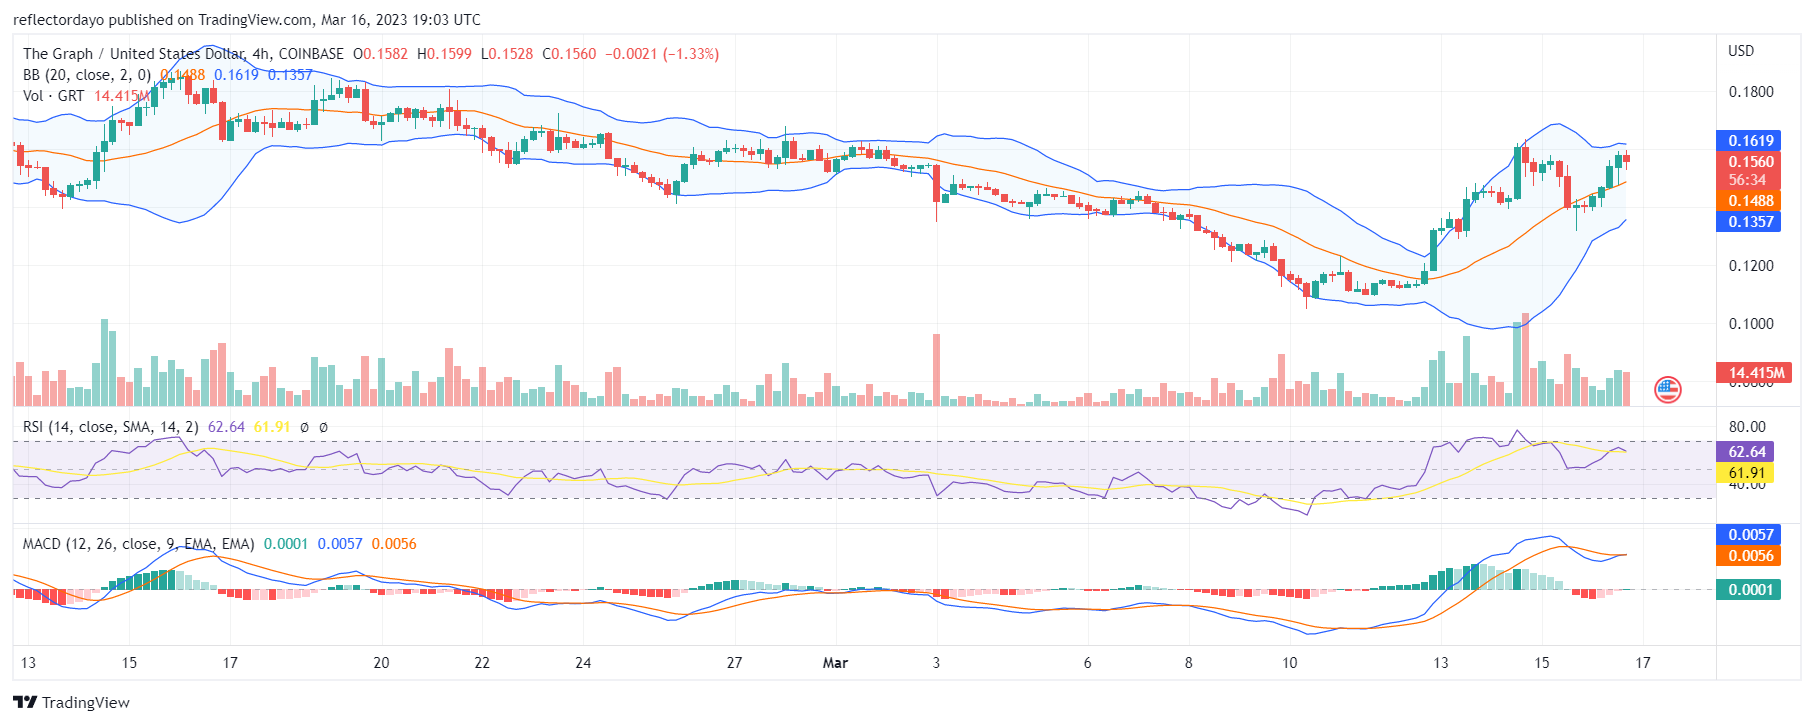
GRT/USD 4-Hour Chart Outlook
The Graph buyers are resilient, but there is also a considerable amount of traders willing to go short at this price level. This deadlock seems to peg the price at this level. However, this will not be for long, as the bears will soon be exhausted and give way to the bulls. The Relative Strength Index (RSI) and the Moving Average Convergence and Divergence (MACD) have a bullish sentiment about the GRT market.