Uniswap (UNI/USD) Trade Falls, Hitting a Resistance
Estimated Reading Time: 4 minutes
Don’t invest unless you’re prepared to lose all the money you invest. This is a high-risk investment and you are unlikely to be protected if something goes wrong. Take 2 minutes to learn more
Uniswap Price Prediction – August 3
Despite another ugly trade situation against the UNI/USD market bulls, the bullish channels are still in place to showcase that the crypto trade falls within them after the price hits resistance around the upper bullish trend line between $6.50 and $7.
The market’s long-position placers need to downsize in order to refocus their efforts and locate a different area where they can accumulate energy in the future. As a preventive measure, fresh shorting order entries should be launched concurrently with the current declines, according to certain levels of up-pulling force features. The near-critical $6 trade point is the line that must remain unbroken in the interim in order to support the negative expectation of additional depreciation development.
UNI/USD Market
Key Levels:
Resistance levels:$7, $7.50, $8
Support levels: $5.50, $5, $4.50
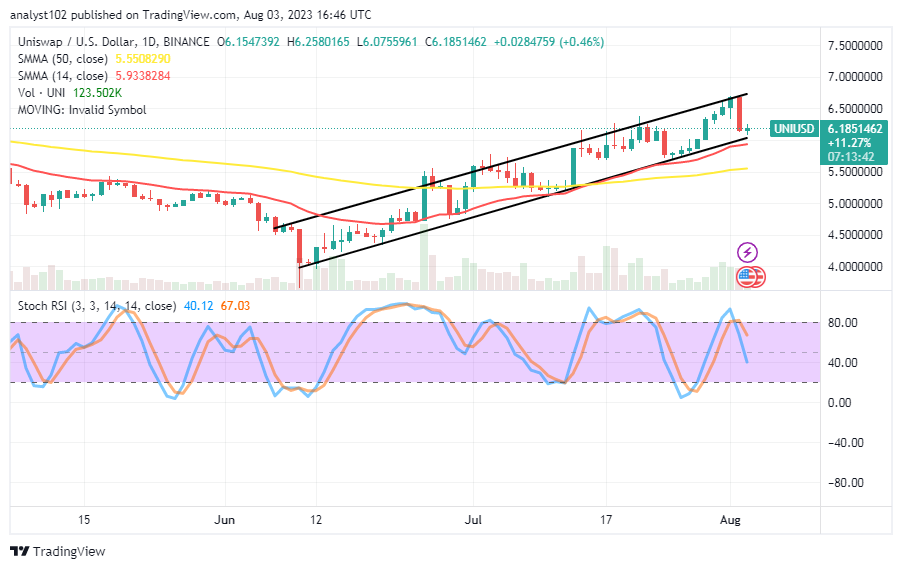
UNI/USD – Daily Chart
The UNI/USD daily chart showcases that the crypto-economic trade falls after hitting resistance a bit above the point of $6.50 while an active bargaining session took place yesterday.
A number of penultimate bullish candlesticks were consumed by the bearish candlestick, which, given its length, served as a strong caution against attempting to resume a rapid long position at this time. The 14-day SMA indicator is at $5.9338284 above the $5.5508290 point of the 50-day SMA indicator. The Stochastic Oscillators have crossed southbound partially from the overbought region from 67.03 to 40.12 values.
What is the most important underlying support line right now to counter the recent dump in the UNI/USD market?
It has been relatively indicated by the interception posture of the Moving Averages that the present most critical support point is set around $5.50, given that the UNI/USD price falls, hitting resistance around a point below $7.
Bulls might be finding it a little bit difficult if they lack the capacity to pull up the weight from the point of the smaller SMA, as they have been backed by the drawing of the lower bullish trend line. A stable decline moving around them to the downside will probably give them a chance to average $5.50.
In terms of the downside technical analysis, buyers might reaffirm their presence to stay inside the bullish channel trading zones, so sellers might be tempted to just jump at the market around the values of the 14-day SMA and the lower bullish trend line drawn. One could wait for an overbought state to be reached before waiting for another round of decent moments to acquire a short entry.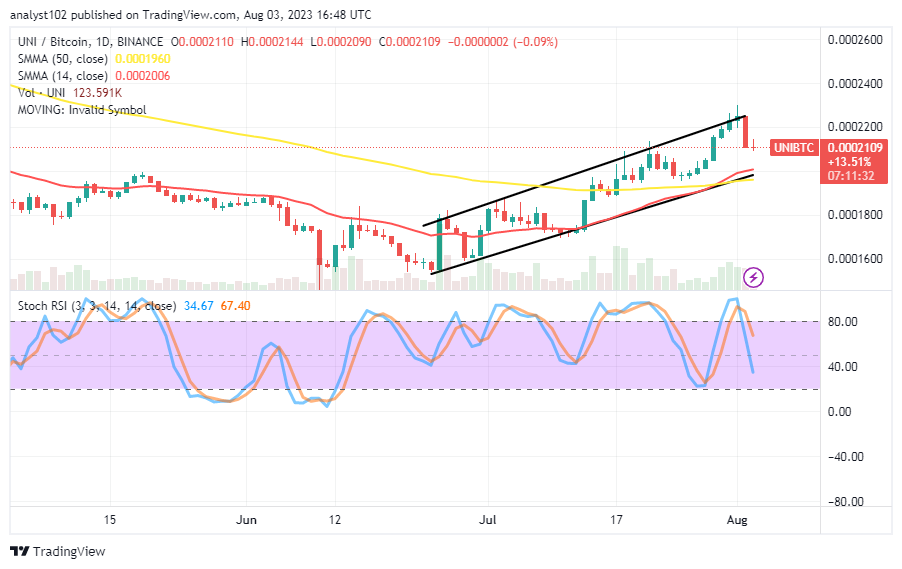
UNI/BTC Price Analysis
In contrast, Uniswap trade falls trading against Bitcoin, following a hit of a resistance point within the bullish trend lines.
A string of candlesticks has emerged above the 50-day SMA trend line, causing the 14-day SMA trend line to momentarily cross it to the upside. There are still roughly 66 values that the stochastic oscillators need to place in the oversold area after moving southward from the overbought area. Consequently, before trying to swing back up, the base cryptocurrency may need to ease off and allow the gravity propensity to the downside to find an end at a bottom base.
Note: Cryptosignals.org is not a financial advisor. Do your research before investing your funds in any financial asset or presented product or event. We are not responsible for your investing results.
You can purchase Lucky Block here. Buy LBLOCK