UMA (UMAUSD) Bullish Activity Could Last Till $11.500
Estimated Reading Time: 3 minutes
Don’t invest unless you’re prepared to lose all the money you invest. This is a high-risk investment and you are unlikely to be protected if something goes wrong. Take 2 minutes to learn more
Market Analysis – UMAUSD Bullish Run Could Continue Till $11.500
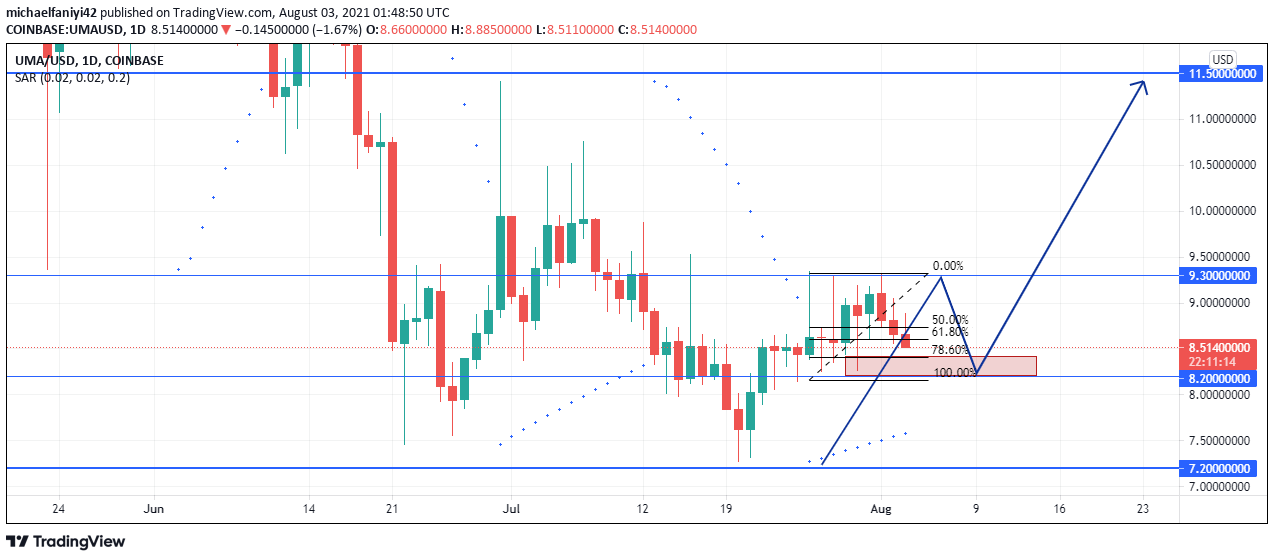
UMAUSD bullish movement may continue till 11.500. UMAUSD has been on an impressive bullish run since 20th July 2021. Price rebounded off the 7.200 level, and bulls took over the market sentiment and began pushing upward. This resulted in an impressive 25% gain in market prices since then. The bullish run has not been without its ups and downs, but the bulls have kept being persistent as they have successfully driven the coin to 9.300, a resistance point that appears to be holding, for now.
Key Levels
Resistance Levels: $9.300, $11.500
Support Level: $7.200, $8.200
Looking at the support and resistance lines plotted, we can observe price arriving at the 9.300 price zone on 26th July 2021. It has since then challenged the zone twice more while failing to break through to the upside. This is indicative that there are many sell orders in this zone that are currently challenging the bulls’ progress.
Bears have successfully defended this level for a few days. It remains to be seen if they can stop the bulls’ advance and push price to take out the 7.200 support level below. This, however, looks very unlikely as UMAUSD bullish run has broken previous resistance levels at 8.200 and looks likely to break the 9.300 point in coming days. The Parabolic SAR (Stop and Reverse) still indicates bullish momentum despite the current drawback in price.

Market Prospects
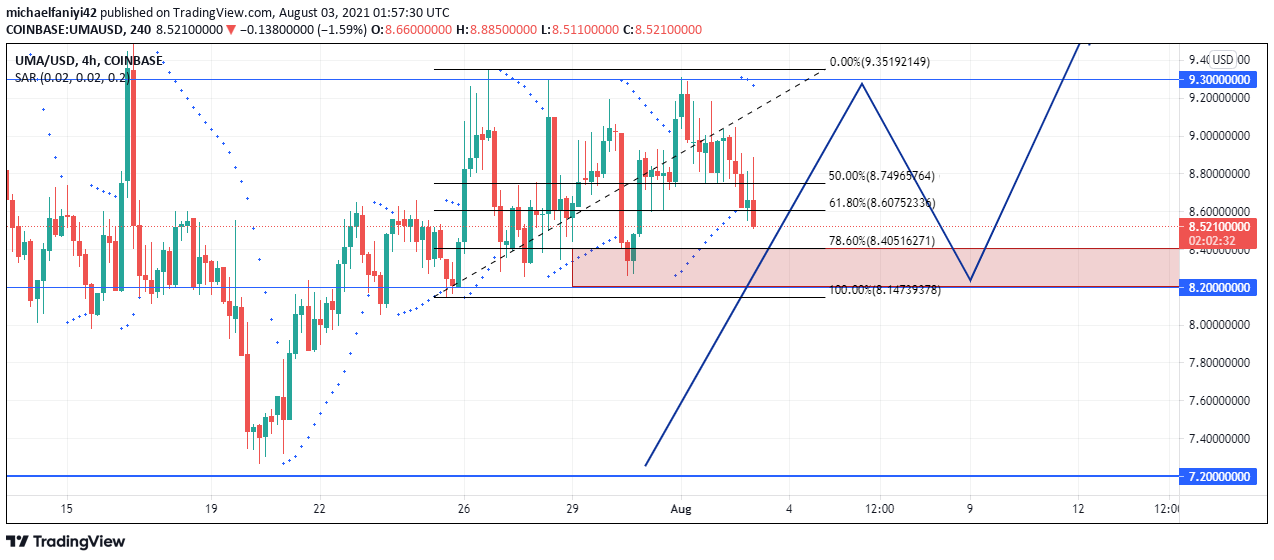
The 4-hour chart looks promising as it offers us an opportunity to go long. The market structure formed shows that price is currently retracing from the peak it formed upon testing 9.300. The support zone around 8.200 looks like a good bouncing point for the coin as it also correlates with the Fibs 78% level at 8.400. This level could be a potential juicy area for going long.
If the bulls keep pushing UMAUSD up and break above the 9.300 resistance point, then we can expect the coin to also hit the 11.500 price level above in the coming days, and if the bullish run proves to be strong, $18.200 can also be taken.
You can purchase crypto coins here: Buy Tokens
Note: Cryptosignal.org is not a financial advisor. Do your research before investing your funds in any financial asset or presented product or event. We are not responsible for your investing results.