Uma (UMAUSD) Is Set for More Upside as It Rebounds off $11.20 Support
Estimated Reading Time: 3 minutes
Don’t invest unless you’re prepared to lose all the money you invest. This is a high-risk investment and you are unlikely to be protected if something goes wrong. Take 2 minutes to learn more
Market Analysis – Bulls Set the Market for More Upwards Movement at the $11.20 Support.
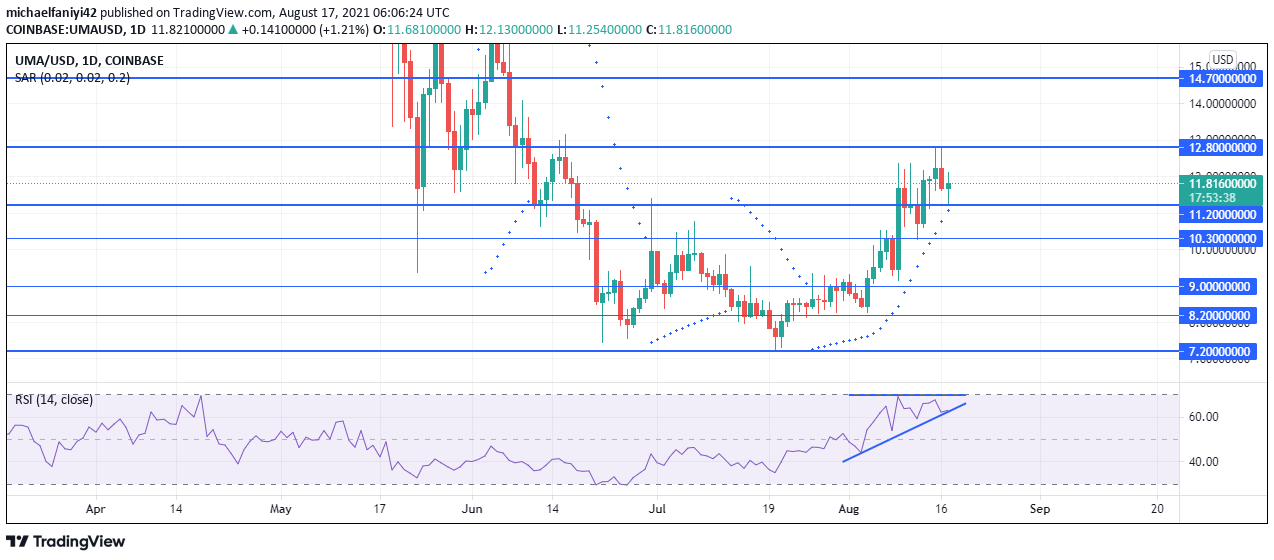
UMA is set for more upside movement in the latest chapter of its rally adventure. Along with other major cryptos, the UMA has been upward abounding. Its breakthrough point is arguably when it violated the $9.00 resistance level after 10 days of persistent pushing. The coin then garnered support at $9.00 to surge past the $10.30 and $11.20 key levels. Thereafter, UMA has been reaching for higher prices steadily.
UMA Significant Levels
Resistance Levels: $14.70, $12.80
Support Level: $11.20, $9.00
At the $11.50 key level, the coin touched the border of the overbought region and decided to take a breather at $10.30. This is to seek support to set itself up for more upsides. This enabled UMA to move to the next key level at $12.80. However, price was rejected at this level, and the coin has again pulled back to receive support at the $11.20 key level. Bulls are now surging upwards again with the hope of breaking through $12.80 also.
The Parabolic SAR (Stop and Reverse) indicator still indicates bullish movement, this is despite the consistent retracement in the market at different points. The RSI (Relative Strength Index) reflects the coin’s consistent retest and break strategy. This movement has now formed an ascending triangle with the border of the overbought region on the daily RSI chart. This should propel the crypto into more upside movement into the overbought region.

Market Prospects
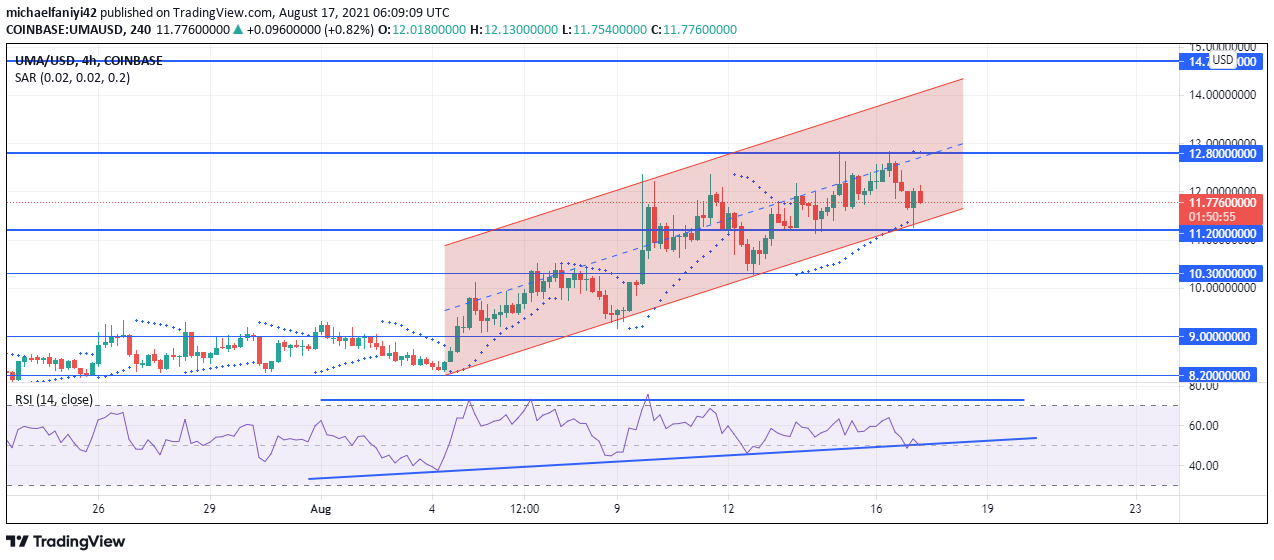
On the 4-hour chart, UMA has been sliding up a parallel channel and is currently trading at the lower half of the channel. Price has bounced off the lower border of the channel, seeking to first break above the middle line of the channel. A strong momentum will be needed though, as the middle line coincides with the $12.80 resistance. If the coin fails immediately, it can still be carried up the channel for another test at the resistance and the middle line. Meanwhile, on the 4-hour RSI chart, the signal is tapering to the tip of an ascending triangle for a breakout into the overbought region.
With its current formation, the UMA is set for more upside towards the $14.70 region.
You can purchase crypto coins here: Buy Tokens
Note: Cryptosignal.org is not a financial advisor. Do your research before investing your funds in any financial asset or presented product or event. We are not responsible for your investing results.