UMA (UMAUSD) Keeps Sliding Down Under Bearish Pressure
Estimated Reading Time: 2 minutes
Don’t invest unless you’re prepared to lose all the money you invest. This is a high-risk investment and you are unlikely to be protected if something goes wrong. Take 2 minutes to learn more
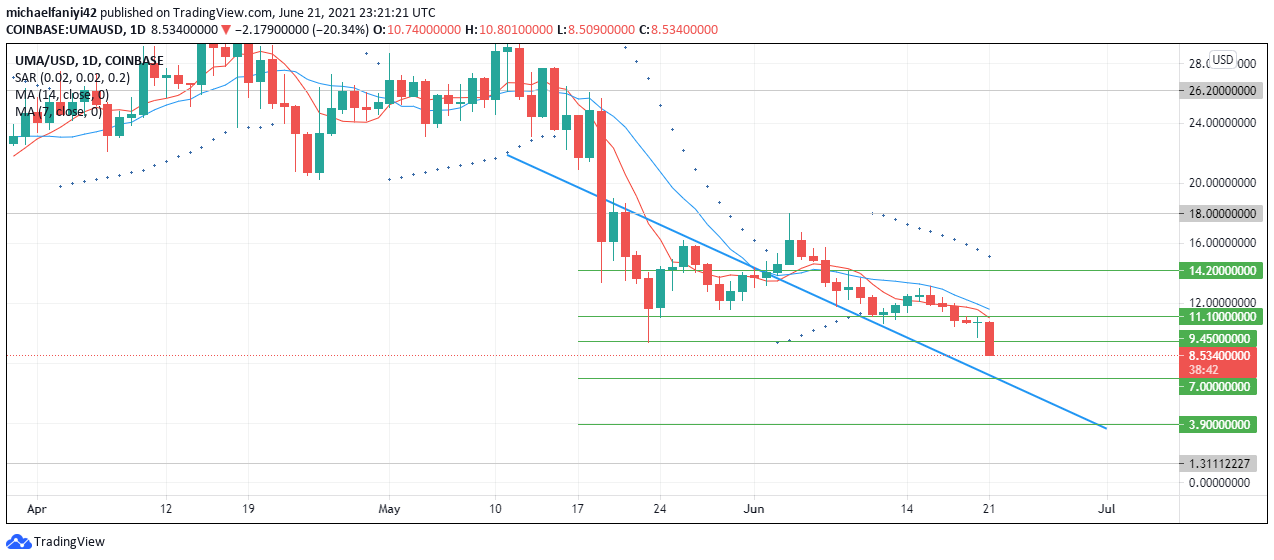
UMAUSD Analysis – Bearish Pressure Keeps Uma Sliding Down
UMA remains under pressure from sellers and keeps sliding down. On the 19th of May, the bears took control of the market, and the price fell from the $26.200 key level to the $14.200 key level.
The bulls wanted to take the price back up immediately, but could only go as high as $18.000, and the market was brought further down from that point to $9.450. There was a sharp rejection to push the price up, and with $11.100 as support, the coin broke past $14.200. Bearish pressure plunged the market once again to the $11.100 key level. UMA was able to jump from there to the $18.000 resistance.
Following that, the sellers effectively controlled the market. They immediately plunged the market from the $18.000 resistance and set the coin on the path of a downward trend.
The daily chart currently shows a full and strong bearish candle forming for the day, showing active bearish activity. The Parabolic SAR (Stop and Reverse) has aligned its dots above the candles, thereby showing no imminent sign of a change in UMA direction.
The 7 and 14 MAs (Moving Averages) have crossed each other downwards since the 10th of June 2021. The 14MA, in particular, can be seen above the candles, acting as resistance, thereby aiding their bearish momentum.
UMA Significant Zones
Resistance Zones: $11.100, $9.450
Support Zones: $7.000, $3.900

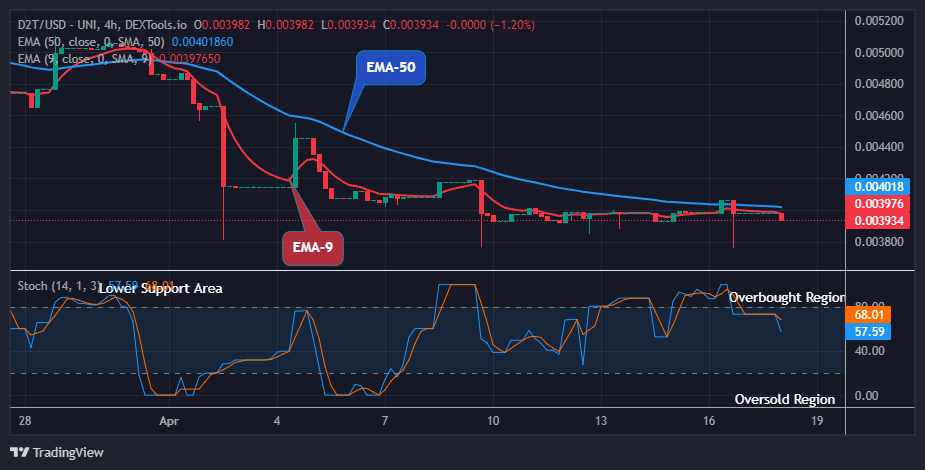
What to Expect as UMA Keeps Sliding Down

On the 4-hour chart, the market can be seen sliding down the descending trend line. Both the 7 and the 14 Moving Average indicators can be seen above the candles, acting as resistance to them in a continuous bearish slide. The Parabolic SAR currently has 5 dots stationed above the market. UMA is therefore heading strongly down in price.
UMA has fallen beyond its $9.450 support and the price is approaching $7.000.
You can purchase crypto coins here. Buy Tokens
Note: Cryptosignal.org is not a financial advisor. Do your research before investing your funds in any financial asset or presented product or event. We are not responsible for your investing results.