UMA (UMAUSD) Remains Below $14.700 Despite the Bullish Revival
Estimated Reading Time: 3 minutes
Don’t invest unless you’re prepared to lose all the money you invest. This is a high-risk investment and you are unlikely to be protected if something goes wrong. Take 2 minutes to learn more
UMA Analysis – Price Remains Below Weekly Resistance
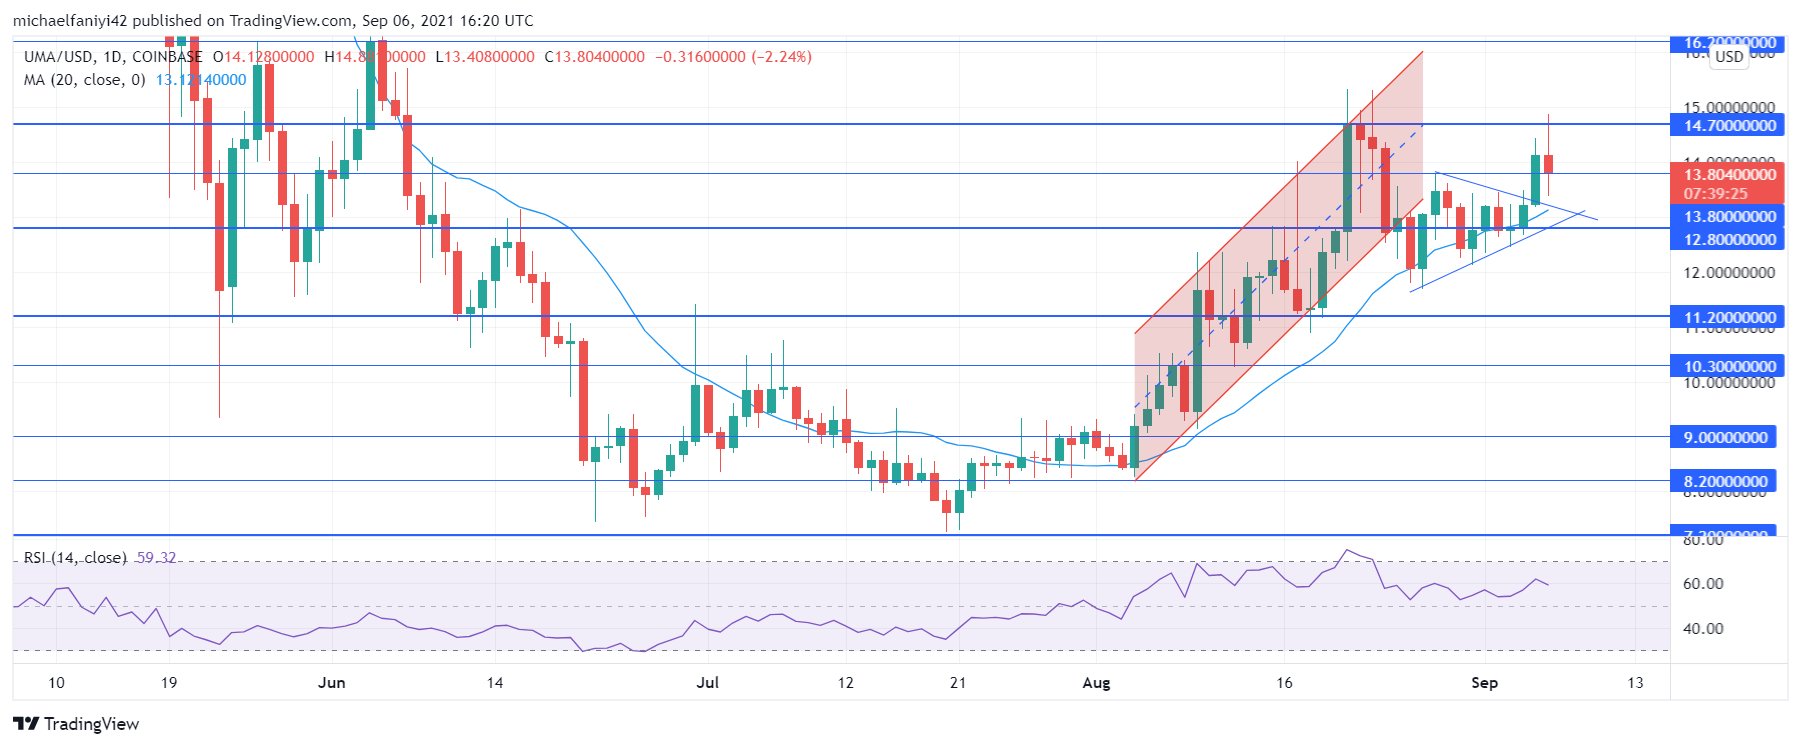
UMA remains below the $14.700 resistance despite renewed bullish vitality. Initially, the failure of the coin to break above the same resistance led the market to depression, in which UMA sank to the $12.800 support. From there, the coin started struggling to prevent further falls. The bulls and bears became locked in a battle for prominence. This eventually led to the formation of a symmetric triangle pattern.
UMA Key Levels
Resistance Levels: $14.700, $16.200
Support Levels: $13.800, $12.800
The formation of the symmetric triangle pattern began on the 25th of August 2021 after the price fell and lasted for 11 days till the 4th of September 2021. The $12.800 price level acted as the reference level at which price undulated and tapered down the triangle formation, and it played a role in the eventual outcome of the market.
UMA finally broke out of the symmetric triangle pattern on the 5th of September 2021. A couple of factors contributed to the upside break out of the market. The EMA of the Envelope indicator acted as a support and kept pushing the market upward. This, in conjunction with the $12.800 key level, which is bull biased, helped the upside break of the market. Notwithstanding, UMA failed at $14.700 and remains below it. The Stochastic Oscillator, which is upward abounding, however, indicates that there is more upside movement to come.

Market Anticipation
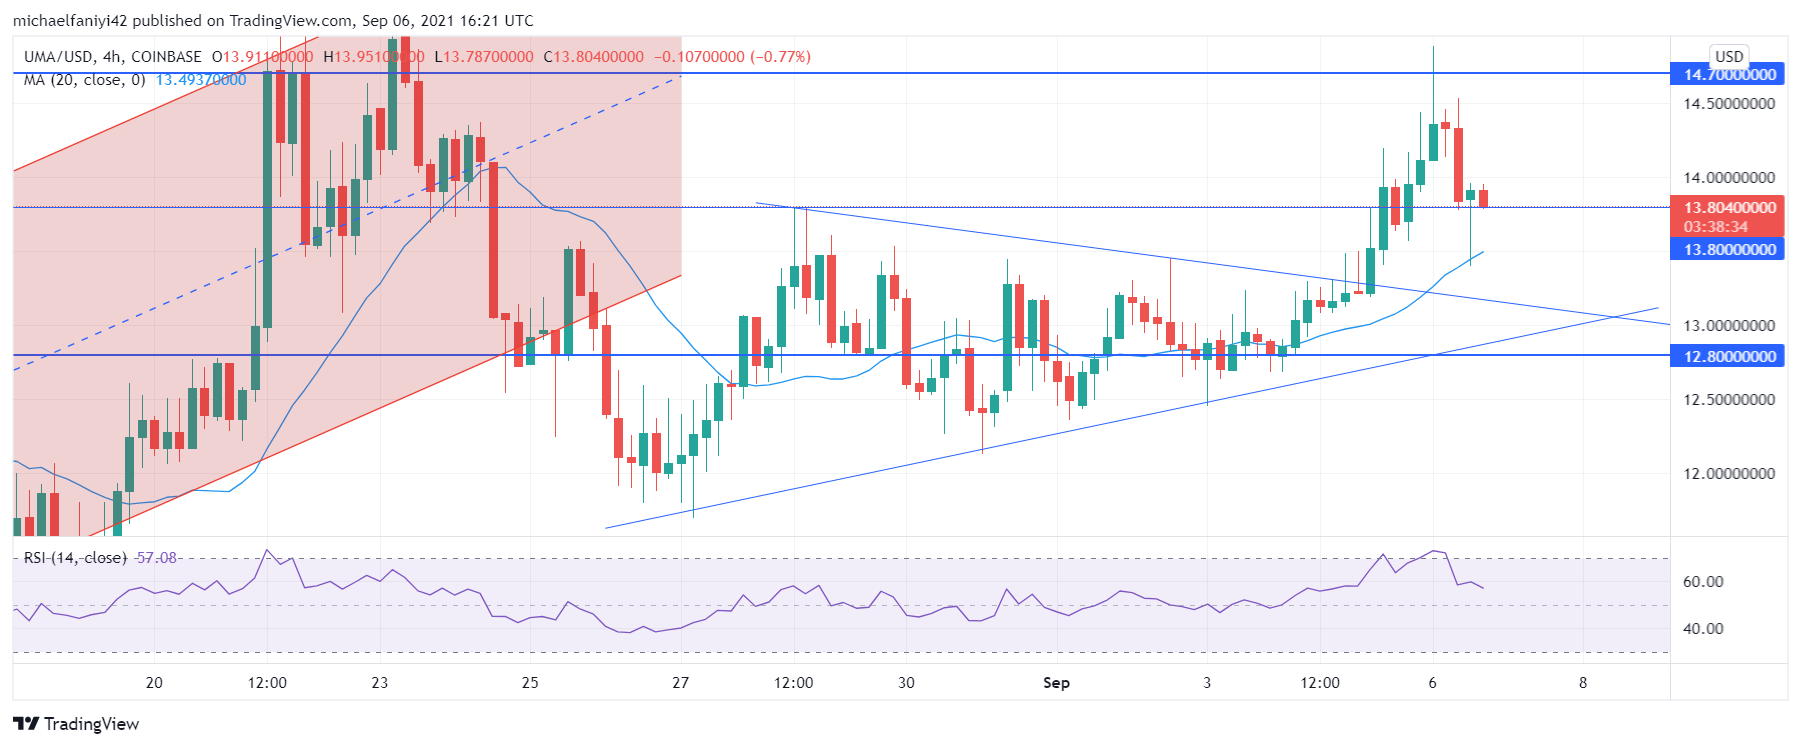
Having bounced off the confluence of the Envelope’s EMA and the $12.800 key level, UMA is now charged with momentum and tasked with negotiating itself past the $14.700 resistance level, which now confluences with the upper line of the Envelope indicator on the 4-hour chart. Just like on the daily chart, the Stochastic Oscillator is indicating more upside movement as its signal lines remain below the overbought region border. There is now an upward cross of its line to that effect.
UMA is expected to climb above the $14.700 key level to reach $16.200.
You can purchase crypto coins here: Buy Tokens
Note: Cryptosignal.org is not a financial advisor. Do your research before investing your funds in any financial asset or presented product or event. We are not responsible for your investing results.