UMA (UMAUSD) Sellers Are Taking Their Toll on the Market
Estimated Reading Time: 2 minutes
Don’t invest unless you’re prepared to lose all the money you invest. This is a high-risk investment and you are unlikely to be protected if something goes wrong. Take 2 minutes to learn more
UMA Analysis – The Sellers Are Taking Their Toll on the Market
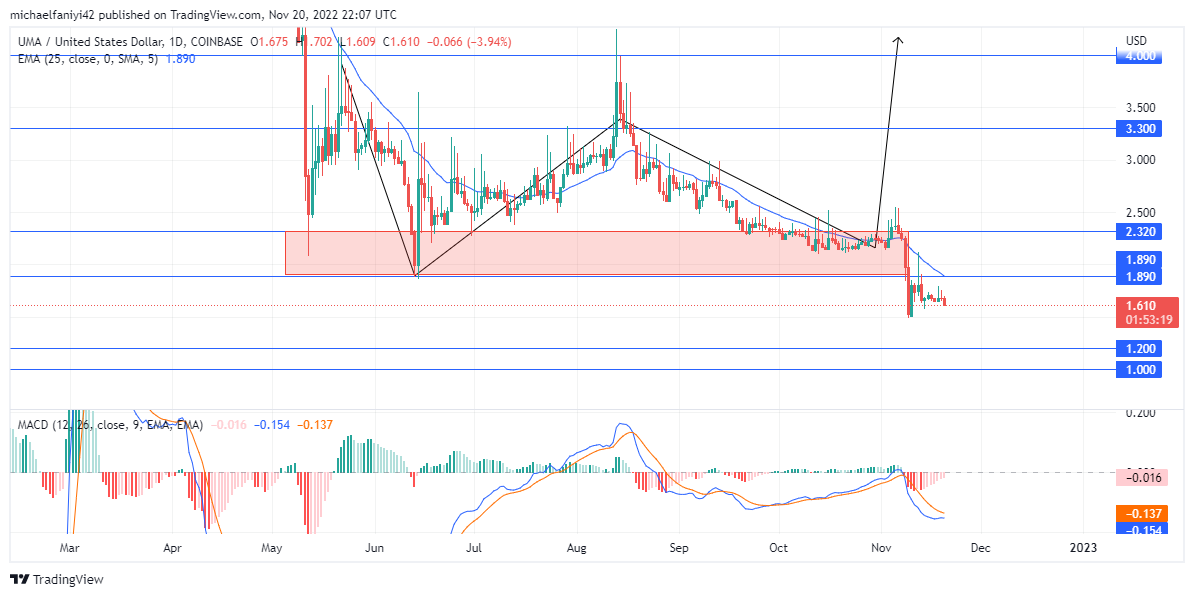
UMA Sellers are now taking their toll on the market, especially after a failed bullish formation. The price has been well structured to conform to a bullish double-bottom shape. However, the structure failed at the last stroke. With that, the bears are back in the market to plunder it even further. As a result, UMA has dropped below the key support zone of around $1.890.
UMA Critical Levels
Resistance Levels: $1.890, $2.320
Support Levels: $1.200, $1.000
The period of interruption in the bearish flow of the market has now ended, and the sellers have resumed taking their toll on the market. The period of the market interruption lasted from the 12th of May to the 6th of November, during which the bulls tried to push up the price using a bullish reversal double-bottom structure. The structure failed to form, and the bears are back in charge.
The first thing the sellers have done in the market is drop the price below the support level of around $1.890 at which the bullish structure rested. The EMA period 25 (Exponential Moving Average) now hangs loosely above the daily candlesticks to show the bearish motion is on course. Likewise, on the MACD chart (Moving Average Convergence Divergence) the lines have bounced off below the zero level.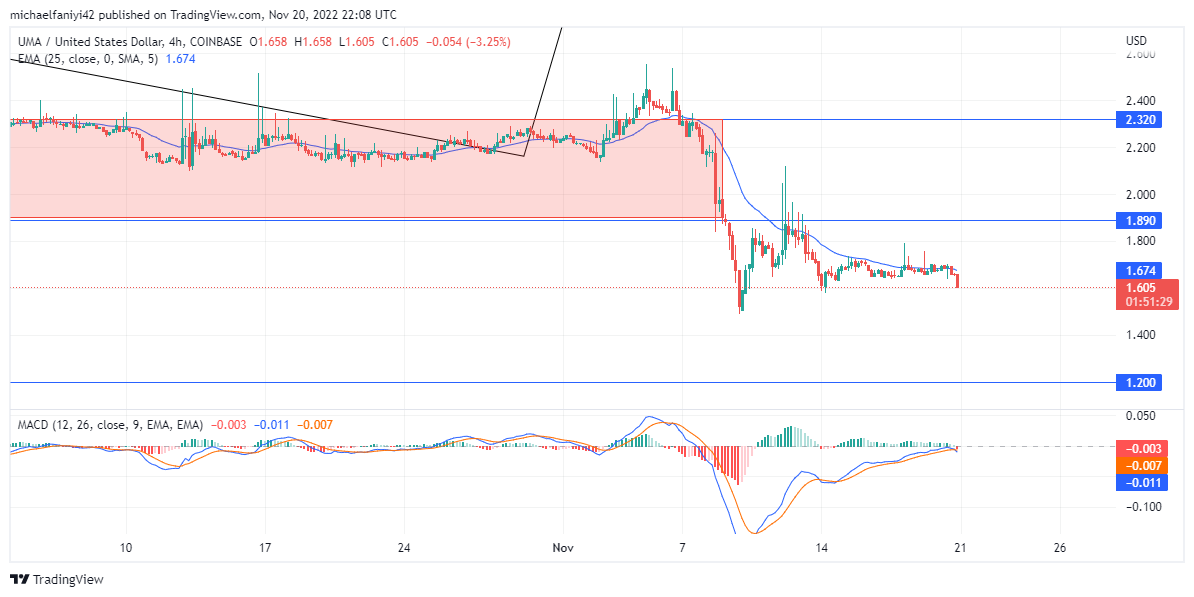
Market Expectations
The 4-hour chart gives a clear view of what is happening currently in the market after the bears took over. We can see that every effort to resuscitate the bullish agenda is blocked at $1.890, which has turned into a resistance level. The MACD lines are trying to navigate through the zero level, failure to make headway will mean more downsides for the coin, potentially falling to $1.200.
You can purchase Lucky Block here. Buy LBLOCK
Note: Cryptosignals.org is not a financial advisor. Do your research before investing your funds in any financial asset or presented product or event. We are not responsible for your investing results.