UMA (UMAUSD) Sinks Below Key Support to Approach an All-Time Low
Estimated Reading Time: 2 minutes
Don’t invest unless you’re prepared to lose all the money you invest. This is a high-risk investment and you are unlikely to be protected if something goes wrong. Take 2 minutes to learn more
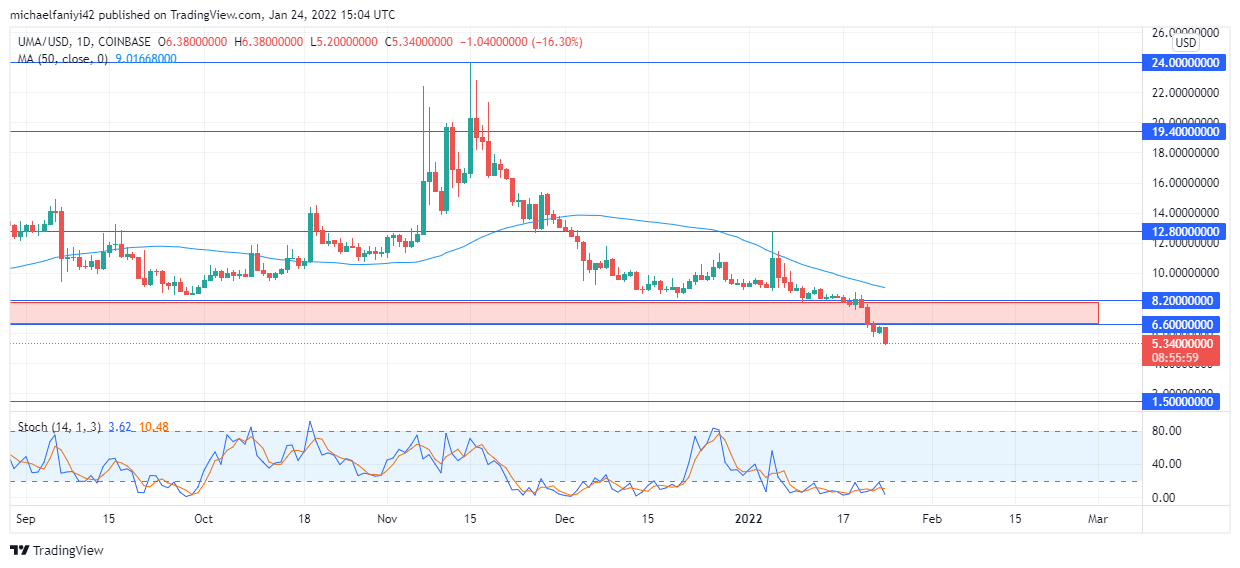
UMA Analysis: Price Sinks Below $8.200, Approaching an All-Time Low
UMA sinks below its strong support level at $8.200, in which the market is left face-to-face with its all-time low level at $1.500. Buyers can be seen putting up a fight for several weeks to combat the intense bearish down pull. A major highlight was on the 5th of January when the price surged but was strongly rejected at $12.000. After a while, buyers become weakened, allowing a further drop below the strong support level.
UMA Significant Zones
Resistance Levels: $24.000, $19.400, $12.000
Support Levels: $8.200, $6.600, $1.500
Along with the global crypto drop, UMA has also been suffering from intense market dips since it attained a 6-month high on November 15th, last year. The coin began an immediate down-slide, which was only temporarily resisted at $12.800. Shortly after, bears broke the hold and sinks further to the strong support zone, which lies between $8.200 and $6.600. Price pushes hard against the support zone.
Market purchasers failed to take full advantage of this hold-up in the market above the strong support to influence it. Eventually, the coin drills through the support zone and sinks below it. The MA (Moving Average) period 50 remains firmly above the daily candles to show strong bearishness. The strong support zone is now against the market. The Stochastic Oscillator shows a prolonged stay of the market in an oversold region.

Market Expectations
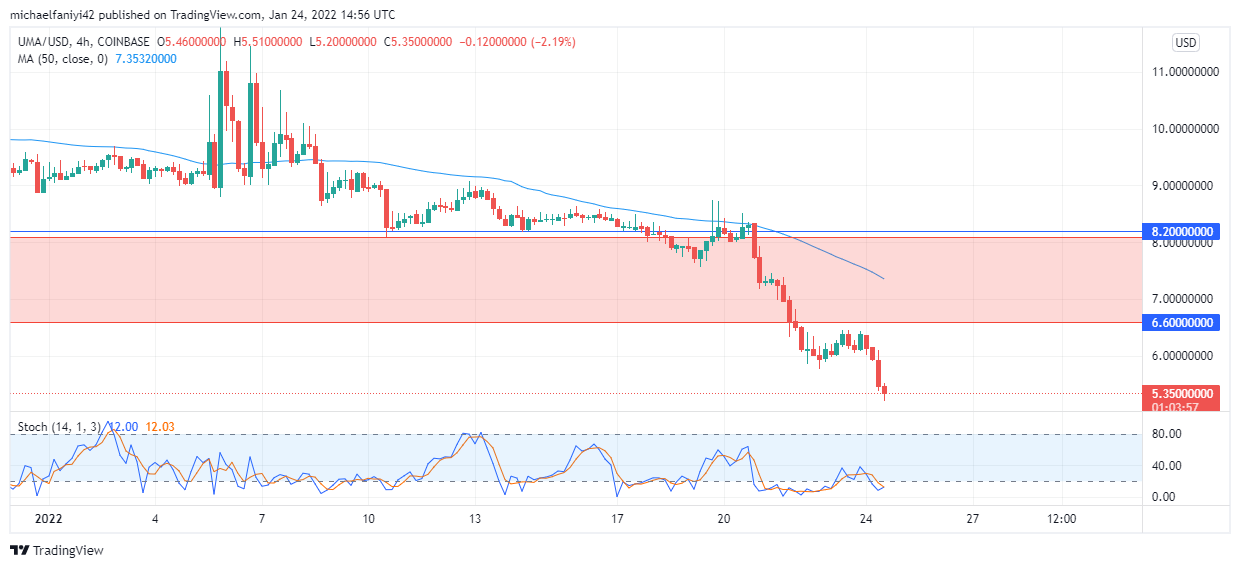
On the 4-hour chart, the MA period 50 remains as resistance as it hangs over the daily candles. Having dropped below the support zone, the price is now in an oversold state. A retracement to retest the support zone could lead the coin to sink further towards its all-time low level of $1.500. There is more possibility of doing this than immediately breaking back upwards through the strong zone, except for the strong influence of market forces.
You can purchase crypto coins here: Buy Tokens
Note: Cryptosignals.org is not a financial advisor. Do your research before investing your funds in any financial asset or presented product or event. We are not responsible for your investing results.