UMA (UMAUSD) Tendency Is Quiet as Price Looks for a Breakout
Estimated Reading Time: 3 minutes
Don’t invest unless you’re prepared to lose all the money you invest. This is a high-risk investment and you are unlikely to be protected if something goes wrong. Take 2 minutes to learn more

Free Crypto Signals Channel
UMAUSD Analysis: The Price Tendency Is Quiet, and It Is Looking for a Breakout
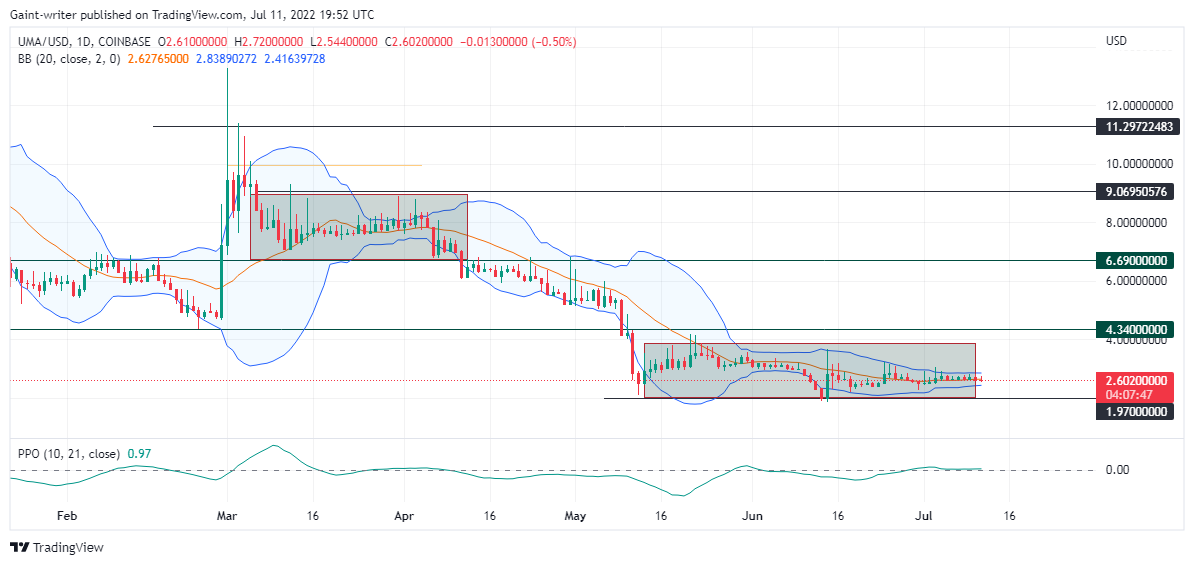
UMAUSD tendency is quiet, with the Bollinger Band indicator looking for a breakout. The activity that has been taking place around the UMAUSD pair demonstrates that the prospects, which also include investors, have been reluctant to cause a significant movement across the cryptocurrency market. There is still some reluctance on the part of buyers to drive the price of the coin higher. The same can be said about the sellers; recently, they have had significantly less engagement.
UMAUSD Key Levels
Resistance Levels: $9.0600, $6.6900
Support Levels: $4.3400, $1.9700
However, with the accumulation phase growing longer, there should be expectations of UMAUSD distribution, which will translate from orders placed on the market. The sellers are quietly engaging in price, with the accumulation still ongoing. A breakout is therefore expected following the Bollinger Band Squeeze. On the other hand, because the accumulation phase is taking more time, there ought to be expectations of UMAUSD distribution, which will translate from orders placed on the market.
The buyers and sellers are still having a low-key conversation about price, and the accumulation is still taking place. Because of this, one should anticipate a breakout after the Bollinger Band Squeeze. As a result of this prolonged accumulation trend, Bollinger Expansion is on the verge of occurring. The pattern of the UMAUSD will shift in response to more orders being placed. As soon as sellers decide to sell short again at the key level of $1.9700, there will be a rally. The Price Oscillator shows that prices have been the same for a while because the signal is at the 0.00 level.

Market Expectations
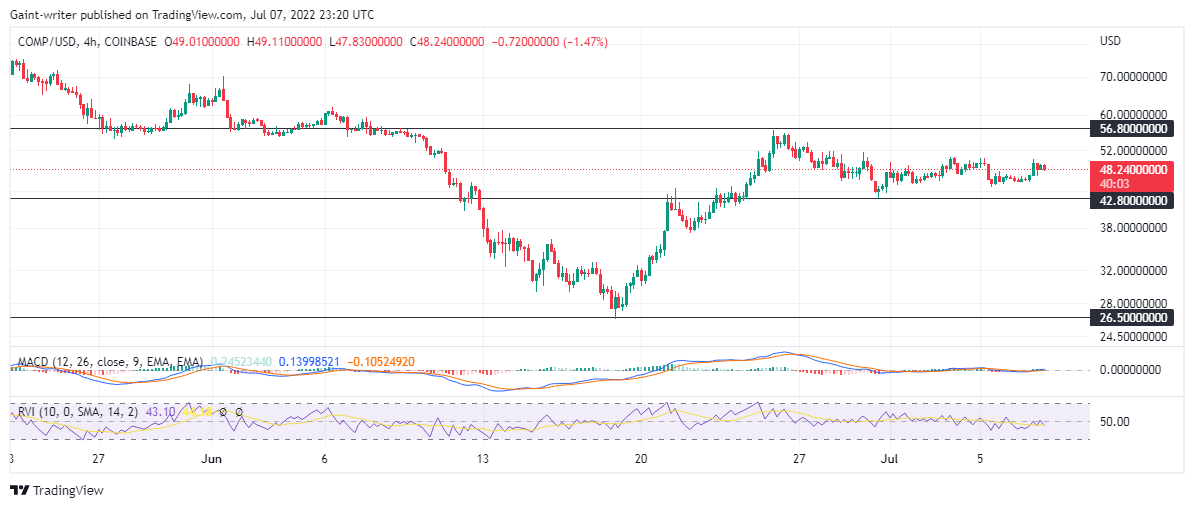
The 4-hour chart reveals that UMAUSD pair is at a standstill. The price configuration on the 4-hour chart will shift in response to the introduction of new orders placed by investors. The squeeze will continue to have an effect on UMAUSD until expansion takes place.
How To Buy Lucky Block
Note: Cryptosignals.org is not a financial advisor. Do your research before investing your funds in any financial asset or presented product or event. We are not responsible for your investing results.