UMAUSD Momentum Indicates Stillness in Price Movement
Estimated Reading Time: 2 minutes
Don’t invest unless you’re prepared to lose all the money you invest. This is a high-risk investment and you are unlikely to be protected if something goes wrong. Take 2 minutes to learn more

Free Crypto Signals Channel
UMAUSD Analysis – Market’s Momentum Indicates a Stillness in Price Movement
UMAUSD momentum indicates stillness in price movement. The price sentiment is believed to be quietly amassing due to the value of the UMAUSD being in decline for a long duration. The sellers submerged the crypto trade downhill as the value was found to have seen a severe collapse in the crypto market. The momentum strength of the token price is neither increasing nor decreasing at the present moment.
UMAUSD Price Levels
Resistance Levels: $13.720, $11.5600
Support Levels: $6.8700, $2.0300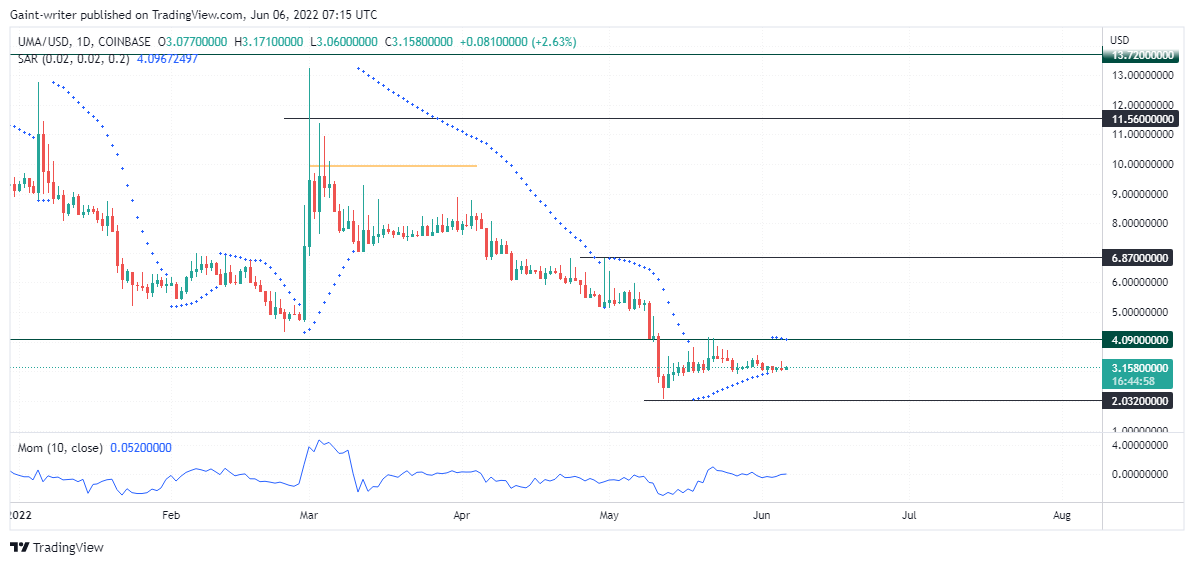
UMAUSD pricing has seen several changes in the price structure. The crypto market shifted from a bullish structure to a bearish one. When the buyers at $13.7200 contested the price structure, the market fell. A bearish trend is taking hold as the price rises over the critical $2.0320 mark.
Are buyers capable of overcoming the current phase of accumulation in the UMAUSD? According to the analysis of the technical data, traders are still able to rally the price inclination above $4.090 successfully. A shift in the price structure will become apparent whenever additional purchasing pressure is applied to the UMAUSD, which will cause the pair to break out of its current state of stillness. The daily chart still shows buyers and sellers accumulating UMAUSD as the token continues in its range.

Market Expectations
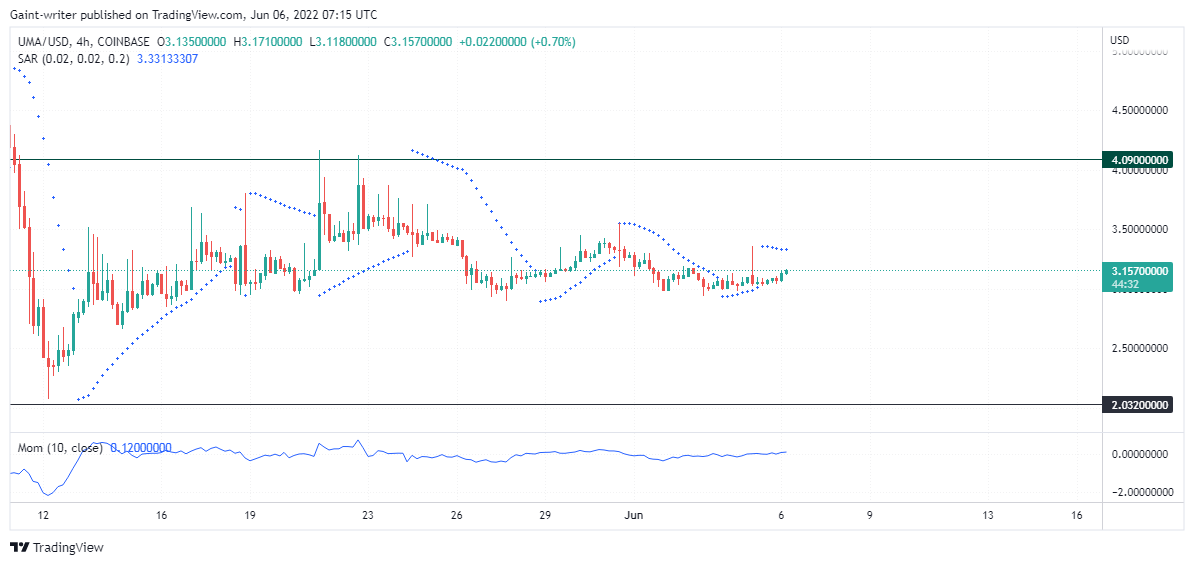
The accumulation of UMAUSD data may be seen rather well on the 4-hour chart. As buyers and sellers continue to displace price, the Parabolic SAR (Stop and Reverse) Indicator will show changing dots. The momentum signal still says that the price will stay the same, but if more pressure is put on it, more orders to buy will grow until they reach the crucial level of $4.0900.
How To Buy Lucky Block
Note: Cryptosignals.org is not a financial advisor. Do your research before investing your funds in any financial asset or presented product or event. We are not responsible for your investing results.