UMAUSD Price Hit Below the $4.3200 Significant Level
Estimated Reading Time: 2 minutes
Don’t invest unless you’re prepared to lose all the money you invest. This is a high-risk investment and you are unlikely to be protected if something goes wrong. Take 2 minutes to learn more

Free Crypto Signals Channel
UMAUSD Analysis – The Price Hit Below the $4.3200 Significant Level as the Crypto Market Aims for Retracement
UMAUSD price hit below the $4.3200 significant level as the crypto market aims for retracement. The sellers of UMAUSD have decamped below $4.3200. This is, however, due to sellers’ concluding orders progressively. As a result, the bearish potency may set its course lower in selling action. The buy traders are presently moving up orders following a break in the UMAUSD level. When the retracement is over, it will move back to the $4.3200 key zone. The bearish potency is analyzed to increase its flow downward.
UMAUSD Price Zones
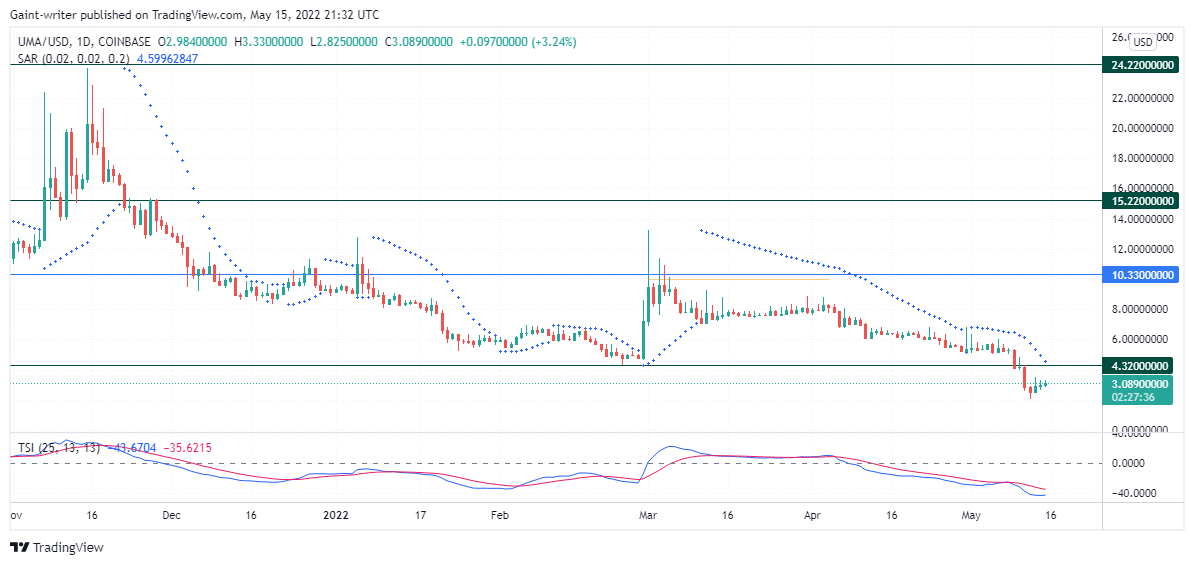
Resistance Zones: $24.2200, $15.2200
Support Zones: $10.3300, $4.3200
UMAUSD made a sharp turn in its structure in mid-November 2021 after a bullish ride up to the $24.2200 significant zone. Bullish failure caused a change in the structure of prices. As the selling tendency commenced, the value of UMAUSD began to reduce. The sellers continue to approach the price lower. The Parabolic SAR (Stop and Reversal) indicator gives a clear impression of bearish formation in the UMAUSD pair.
The bullish arm of the market tried to engage its strength when the value arrived at $4.320. The price moved with sharp liquidity but failed to rise to $15.220, where there are more pending orders. The parabolic SAR indicator from here shows prices displaying downward as UMAUSD is below the $4.3200 key zone. The True Strength Indicator is also moving in the bear zone as the value generally decreases.

Market Expectations
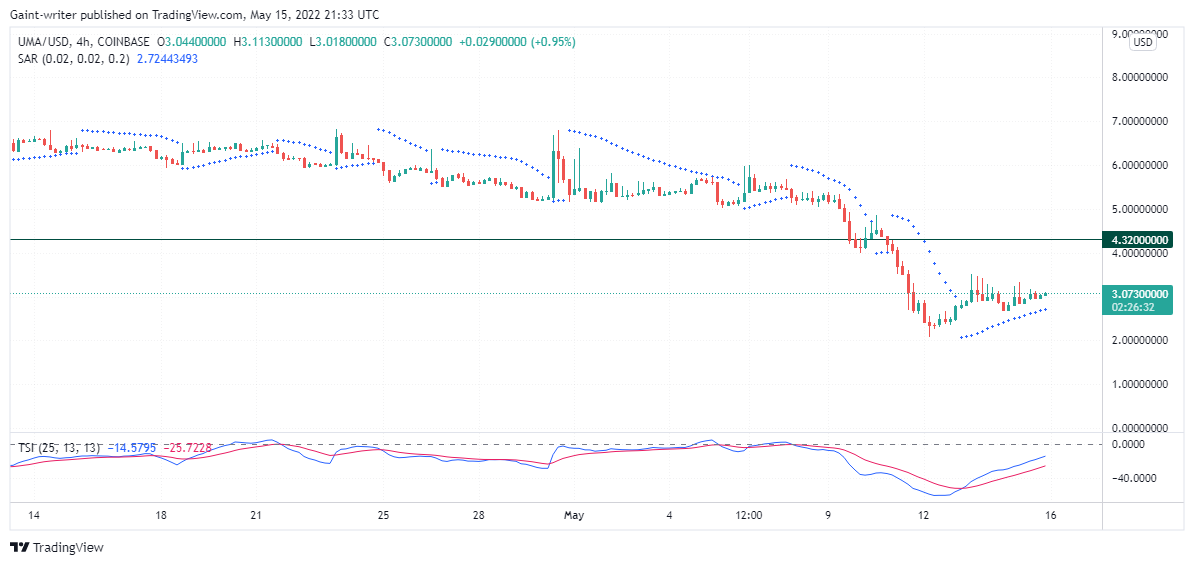
The buy merchants are aiming to trade the value to pull the price back to the $4.3200 key zone. Following this pullback in the UMAUSD, the market is predicted to go down as the tension of the sellers’ increases. The 4hr chart, therefore, shows price potency on retracement back to the $4.3200 key level.
How To Buy Lucky Block
Note: Cryptosignals.org is not a financial advisor. Do your research before investing your funds in any financial asset or presented product or event. We are not responsible for your investing results.