UMAUSD Rejects Bulls Intentions as Price Continues to Accumulate
Estimated Reading Time: 3 minutes
Don’t invest unless you’re prepared to lose all the money you invest. This is a high-risk investment and you are unlikely to be protected if something goes wrong. Take 2 minutes to learn more

Free Crypto Signals Channel
UMAUSD Analysis: The Market Rejects the Bulls’ Intentions as Price Influences Continue to Accumulate Below the $8.800 Key Level
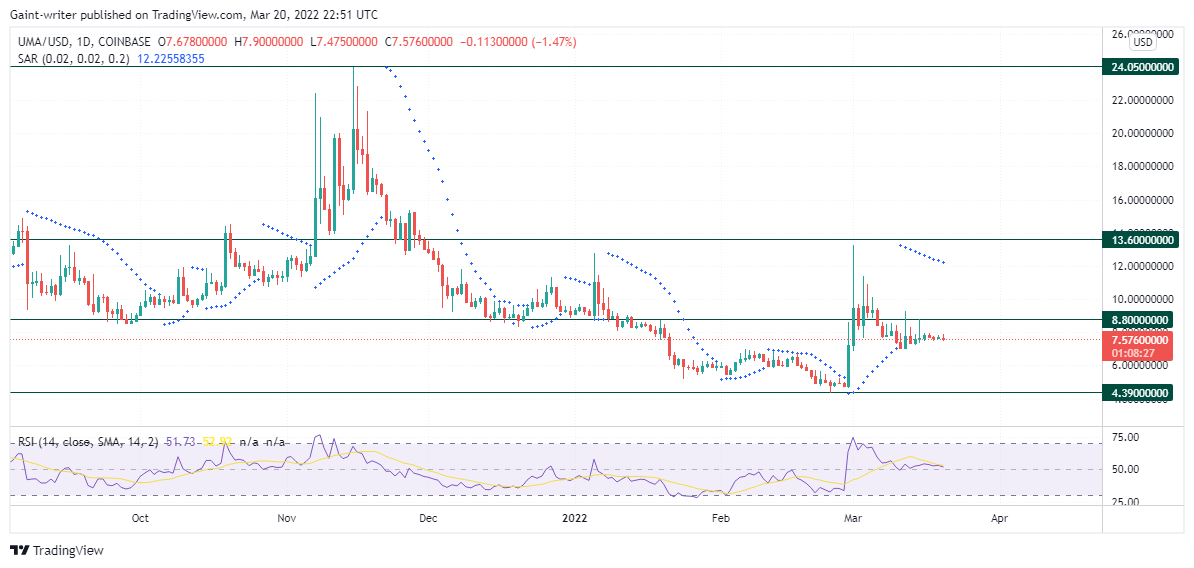
UMAUSD rejects the bulls’ intentions as price influence continues to accumulate below the $8.800 key level in the market. The sell traders are currently trying to operate the market to progress downward. The bulls’ intentions were apprehended in the market when the price attempted to break the $8.800 key level. The price rejections with strong wicks were displayed, which marked a sign of bullish rejection in the market. With the buyers facing opposition near this level, the selling prospects will manipulate the price trend in the market to keep going down.
UMAUSD Key Levels
Resistance Key Levels: $24.050, $13.600
Support Key Levels: $8.800, $4.390
The buyers entered the market order after a short accumulation around October 2021. However, the price consolidation brought about bullish distribution in the market as price orders flowed upward, cracking through the $13.600 significant point in the price action. The price eventually rose to $24.050 with long wicks, making it its highest point in the market. Following its recent all-time high in the market, the buyers’ bias eventually ended in the market.
Following the bullish break up towards the $24.050 significant level, the sell traders began to influence the price tendency downward in the market, taking over several key influences. The bear market phases through several old order blocks in the market where there can be price reactions. UMAUSD finally made its way down to the $4.300 significant point. The bulls from this key level decided to shoot the price back to the $13.600 key level, but the price faded out due to price rejection. The sell traders are currently operating the price as the UMAUSD is anticipated to undergo a sell bias in the market.

Market Expectations
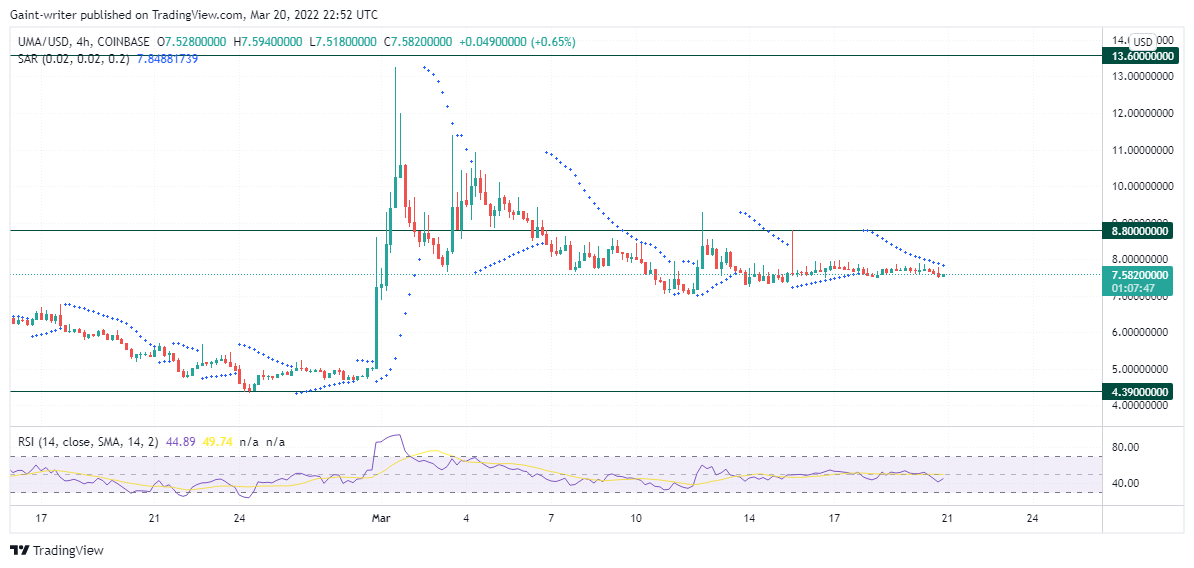
The 4hr chart in the market shows price is expected to go down due to the bulls’ rejection of price influence. The Parabolic SAR (Stop and Reverse) indicator shows a downward price tendency. The RSI (Relative Strength Index) shows that the price is moving into the sell zone in the market as the sell trend moves back to the $4.390 significant level.
How To Buy Lucky Block
Note: Cryptosignals.org is not a financial advisor. Do your research before investing your funds in any financial asset or presented product or event. We are not responsible for your investing results.