Uniswap (UNI/USD) Bounces from a Lower Value of $30
Estimated Reading Time: 3 minutes
Don’t invest unless you’re prepared to lose all the money you invest. This is a high-risk investment and you are unlikely to be protected if something goes wrong. Take 2 minutes to learn more
Uniswap Price Prediction – May 13
After a witness of downward pressure in the last couple of days, the market valuation of UNI/USD has bounced from a low of around $30. Price now trades around a 5.17% increase at the value of $38.78 or thereabout.
UNI/USD Market
Key Levels:
Resistance levels: $45, $50, $55
Support levels: $35, $30, $25
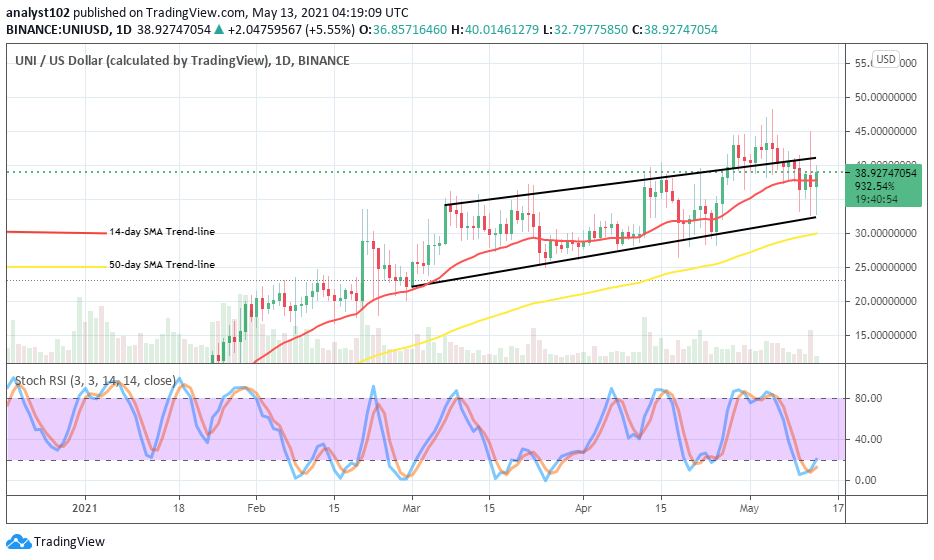
UNI/USD – Daily Chart
The UNI/USD daily chart has shown the crypto’s activities as majorly trading back in the bullish channels as price has touched the lower channel yesterday and early today. But, now, the market rebounds averaging the upper channel as of writing. The 14-day SMA trend-line is in the channels above the 50-day SMA. The Stochastic Oscillators are in the oversold region with the crossed hairs pointing to the north to signal that a buying pressure is currently ongoing in the crypto-economy.
Will the next UNI/USD price trade out of channels?
Over time, the UNI/USD price has continually traded in bullish channels that have witnessed variant ups and downs. The upper bullish channel line needs a breakout by more buying pressures on the side of the UNI/USD bulls at the level of $40 and, is devoid of any possible barrier that might have staged at a higher point of $45 to be able to potentially change from the current channel trading zones.
As regards the downside sentiment analysis, the key immediate resistance level of $45 as well needs to be kept firm against more upward pressures in waiting by bears in the market. The moment that that value breaches further to the north, any sell order at that time risks its position of being trapped. However, a return of a correction could in the long run bring down the market only for a re-test.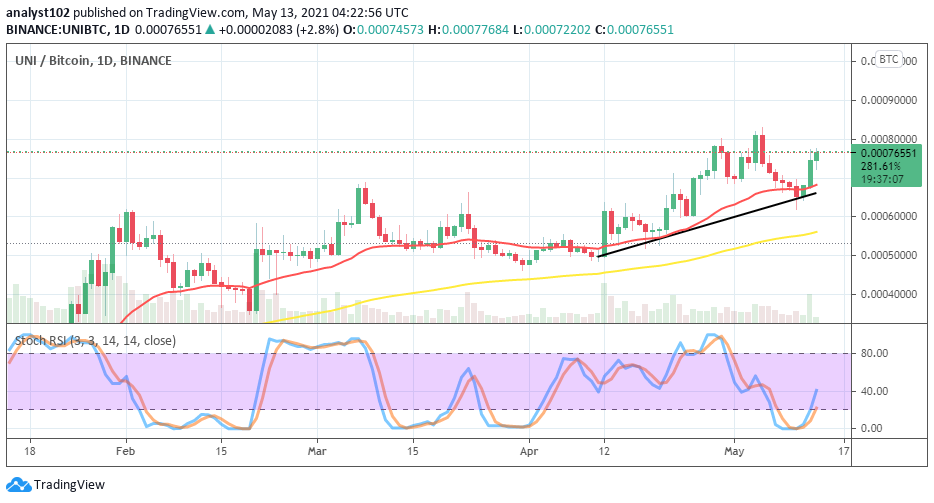
UNI/BTC Price Analysis
In comparison, the UNI/BTC chart yet trades in a bullish outlook. That technically means UNI dominates the market space at the expense of BTC’s present weaknesses. Over time, the base crypto has been pushing smoothly against the flagship counter crypto mostly it finds support around the smaller SMA indicator. The 50-day SMA is underneath the 14-day SMA trend-line. The Stochastic Oscillators have crossed from the oversold region to point northwardly at range 40. That shows the higher probability that the base crypto will still go for higher profits as there has been a formation of two bullish candlesticks already to back the sentiment.
Note: cryptosignals.org is not a financial advisor. Do your research before investing your funds in any financial asset or presented product or event. We are not responsible for your investing results.