Uniswap (UNI/USD) Market Is in Ranges, Struggling for Upsurges
Estimated Reading Time: 3 minutes
Don’t invest unless you’re prepared to lose all the money you invest. This is a high-risk investment and you are unlikely to be protected if something goes wrong. Take 2 minutes to learn more
Uniswap Price Prediction – April 25
A closure technical outlook reveals that a recent correctional move has been embarked upon by the trade, reaching a completion zone of around $7.5, prompting the crypto market to now move in ranges, struggling for upsurges.
The middle Bollinger Band’s moving axis and, more importantly, the $10 resistance level are likely to seriously impede cryptocurrency signals as the market begins to surge higher. The moment any active decline motions surface from around those areas, it would be technically ideal for traders to wait for the repositioning of stochastic oscillators at considerable lower zones to point back to the upside in order to be able to denote when a resumption of bulls will be effective.
UNI/USD Market
Key Levels:
Resistance levels: $9.5, $10.5, $11.5
Support levels: $5.5, $5, $4.5
UNI/USD – Daily Chart
The UNI/USD daily chart showcases that the crypto-economic market is in ranges, struggling for upsurges.
The Bollinger Band trend lines are in a slight southward-bending position to give a clear level of the retracement forces that happened lately. The traversing movement of the stochastic oscillators to the upside has reached a notable level that demonstrates that some energy has been exhausted. And that could lead to a period of recession for a while.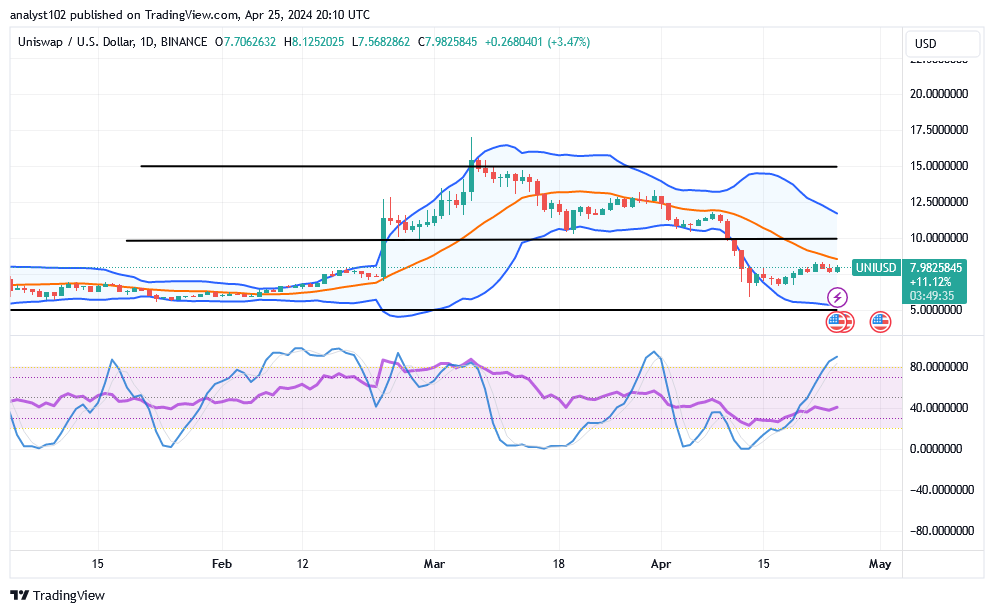
If the price manages to push past the middle Bollinger Band, would it be psychologically acceptable for purchasers to keep pushing above it?
As it has been demonstrated by the formation of candlesticks presently, it appears that the price still needs to pull down for a while in order to be able to garner momentum, given that the UNI/USD market is in ranges, struggling for upsurges.
The resurging market force is likely what long-position movers took advantage of, as stochastic oscillators were placed in lower zones around the lower Bollinger Band. Nevertheless, the moves would be in a consolidation period if the price tried to push farther from beneath the middle Bollinger Band.
Even though there is a chance that the market will see retracements, bears might not be benefiting as much from it. It is advised that sellers avoid overly leveraging their positions near the middle Bollinger Band point.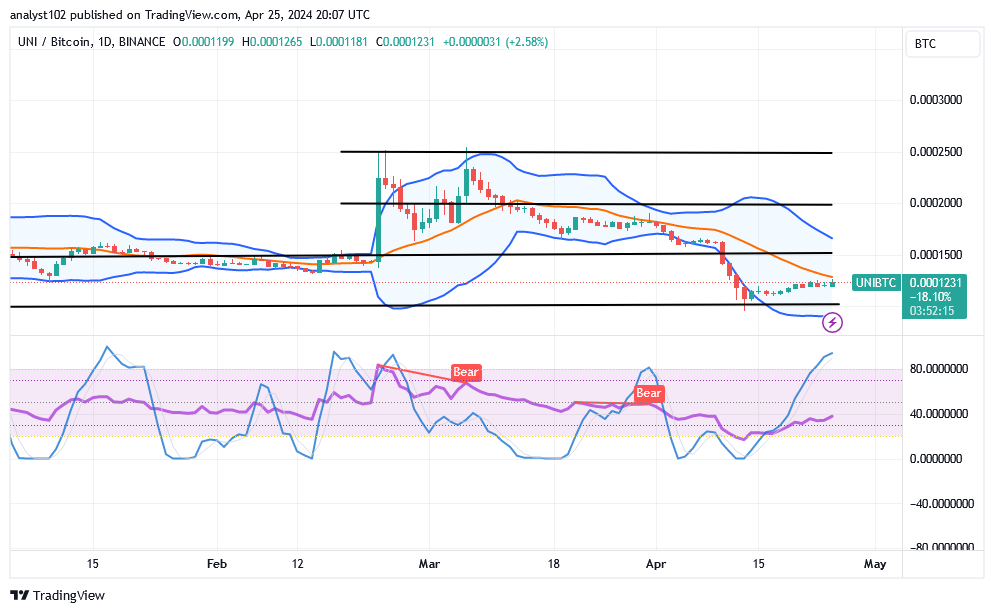
UNI/BTC Price Analysis
In contrast, the Uniswap market is currently moving in ranges versus the market purchasing line of Bitcoin, struggling for upsurges.
Smaller variant candlesticks have been observed between the middle and lower Bollinger Band points. The blue portion of the stochastic oscillators has crossed into the overbought region and is traveling northward, indicating that the base instrument has attained a higher pushing rate. Buyers would have to exercise caution before making any more entries at this time.
\
Note: Cryptosignals.org is not a financial advisor. Do your research before investing your funds in any financial asset or presented product or event. We are not responsible for your investing results.
You can purchase Lucky Block here. Buy LBLOCK