Uniswap (UNI/USD) Market keeps a Consistent Declining Outlook
Estimated Reading Time: 3 minutes
Don’t invest unless you’re prepared to lose all the money you invest. This is a high-risk investment and you are unlikely to be protected if something goes wrong. Take 2 minutes to learn more

Free Crypto Signals Channel
UniswapPrice Prediction – March 10
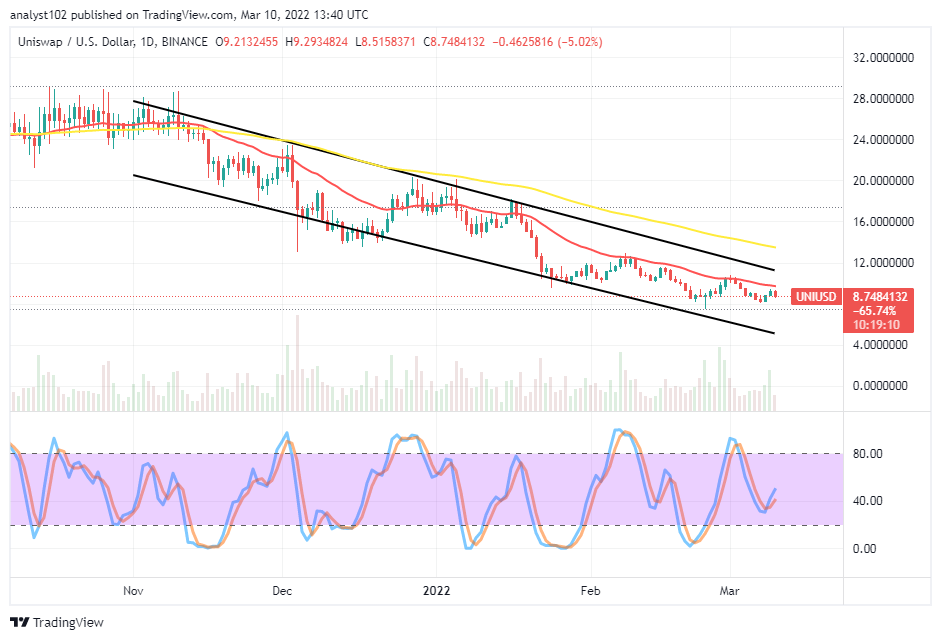
It is still apparent that the UNI/USD market keeps a consistent declining outlook under stable downward-trending settings on a feeble capacity. The up-and-down moving status of the crypto-economic price has witnessed between $9 and $8 at a percentage of about 5.02 negatives.
UNI/USD Market
Key Levels:
Resistance levels: $12, $14, $16
Support levels: $7, $5, $3
UNI/USD – Daily Chart
The UNI/USD daily chart reveals the crypto-economic market keeps a consistent declining outlook as variant smaller candlesticks continually form underneath the trend line of the smaller SMA. The 14-day SMA indicator is above the 50-day SMA indicator. The upper bearish trend line drew over the smaller SMA to indicate that the crypto’s worth wallows in depressions. The Stochastic Oscillators are down into the ranges of 40 and 20. And they are attempting to cross northbound against the higher range-line to signify that a pull-up can surface in no time.
Has there been a sign to signify a change for the UNI/USD trade as the crypto market keeps a consistent declining outlook over time?
There has been no significant sign to portend a change in the UNI/USD trading pattern that has been featuring over time as the crypto market keeps a consistent declining outlook. The upside technical analysis would have it that price has to move down a bit to rebuild support baseline around $8. A sudden fearful breakdown of the value line may potentially create a better chance for a rebound at an early stage of such motion.
On the downside of the technical analysis, the UNI/USD market short-position placers may have to keep been on the lookout for shorting entries alongside the trend line of the smaller SMA. The moment that a full-fledged bullish candlestick formed against the trading indicator in question, some upward momentums may serially feature to face resistances around $12. If that presumption plays out accordingly afterward, bulls may fail to count upon that level to achieve more profits in the long run.
UNI/BTC Price Analysis
In comparison, Uniswap’s trading capacity has been running in a slow-and-steady manner against Bitcoin to the downside. In other words, the cryptocurrency pair market keeps a consistent declining outlook below the SMA trend lines. The 50-day SMA indicator is above the 14-day SMA indicator. The Stochastic Oscillators have clogged around the range of 40 in an attempt to cross northbound. The outlook of the formation of the candlestick so far has been tinier, representing variant fall-offs. That signifies the base crypto may not be pushing for sustainable momentums against its counter crypto.
Note: Cryptosignals.org is not a financial advisor. Do your research before investing your funds in any financial asset or presented product or event. We are not responsible for your investing results.
You can purchase Lucky Block here. Buy LBlock: