Uniswap (UNI/USD) Market Marks Down, Trying to Find a Baseline
Estimated Reading Time: 3 minutes
Don’t invest unless you’re prepared to lose all the money you invest. This is a high-risk investment and you are unlikely to be protected if something goes wrong. Take 2 minutes to learn more
Uniswap Price Prediction – August 24
The Uniswap market operations have suffered a setback in their valuation against the US economy as the crypto market marks down a point around $4.50, trying to find a baseline.
At this point in time, selling activities that will be trailing the remaining falling force will potentially allow a quick rebounding move that is capable of nudging the transaction line back into northward rising situations. This attitude prompts holders of long positions to begin repurchasing shares at a discount, even though the price is likely to continue falling in the coming weeks from its current low point.
UNI/USD Market
Key Levels:
Resistance levels:$5.50, $6, $6.50
Support levels: $4.50, $4, $3.50
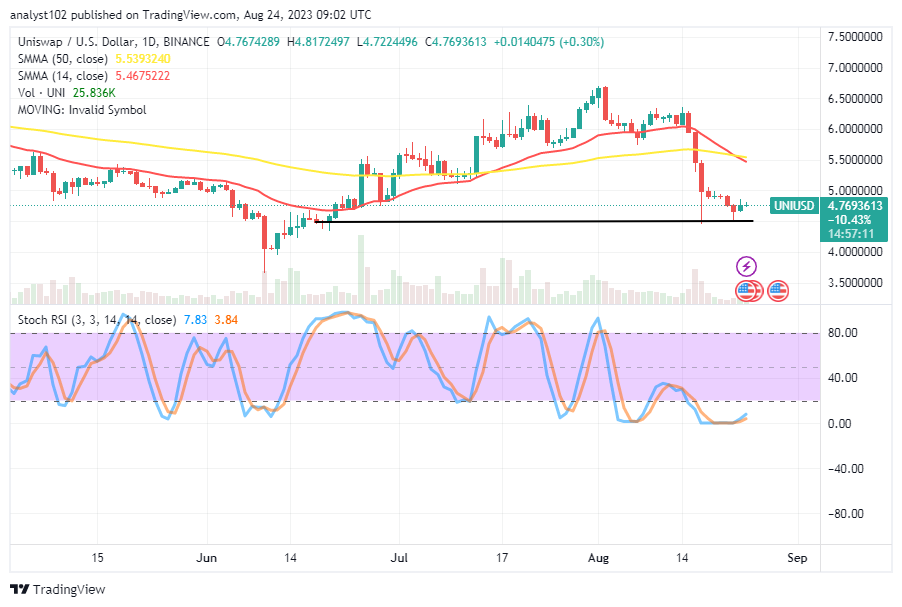
UNI/USD – Daily Chart
The UNI/USD daily chart reveals the crypto market marked down to touch the support level of $4.50 during the last heavy decline, trying to find a baseline in the process.
The positioning of the 14-day SMA indicator against the 50-day SMA indicator is in the manner of trying to show that an amount of falling pressure may still be put on the base trading instrument below the moving averages at $5.5393240 and $5.4675222 for a while. The stochastic oscillators have tightly moved around the zero point in the oversold region before crossing from 3.84 to 7.83 points.
Has there been any indication that the UNI/USD market won’t see a bearish motion continuation trend beyond the $4.50 support?
Some light forces to the downside have featured in ways of portending touch signals around a lower-trading zone of the $4.50 support in the UNI/USD trade operations, given that the crypto business marks down, trying to find a baseline around the value.
If bears are forced to push prices lower than the $4.50 key support level, it will take a lot of work. And it might prolong the situation where candlesticks come in a variety of varying lengths every day.
Given that the lower horizontal line drawn at $4.50 is where the SMAs are located in relation to the present trading spot, it seems more technically appropriate to start launching a buy order with confidence rather than following any other trading course.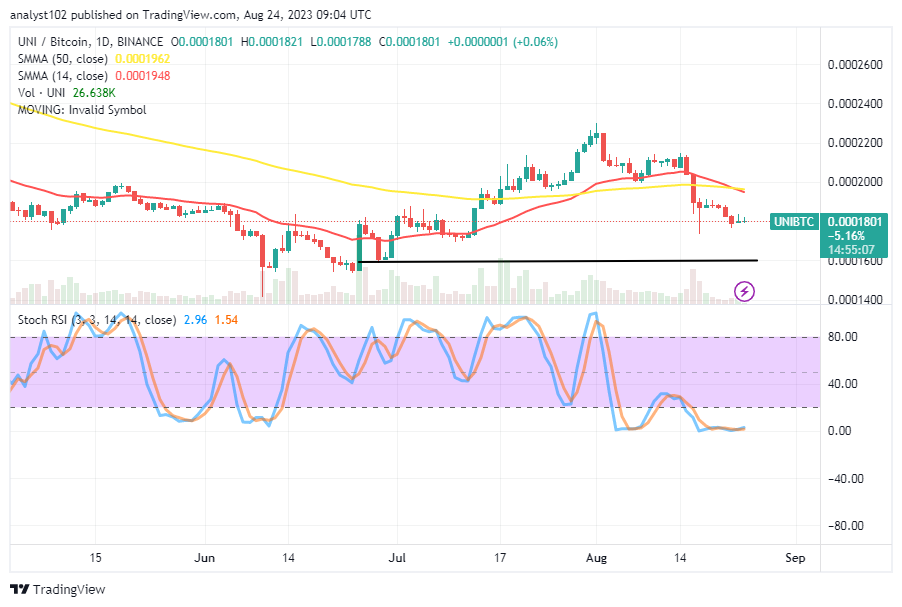
UNI/BTC Price Analysis
In contrast, the Uniswap market marks down against the trending weight of Bitcoin, above the lower horizontal line drawn, trying to find a baseline.
A line of smaller candlesticks has been formed to depict that the pairing cryptocurrency market is in consolidation mode, trying to find a base before swinging back to the northward side.The 14-day SMA indicator has curved southward to slightly place itself across the 50-day SMA indicator, portending that the price is wallowing in a decline. The stochastic oscillators are swinging tightly in the oversold region, keeping points between 1.54 and 2.96. It shows that counter-crypto is on the verge of losing out.
Note: Cryptosignals.org is not a financial advisor. Do your research before investing your funds in any financial asset or presented product or event. We are not responsible for your investing results.
You can purchase Lucky Block here. Buy LBLOCK