Uniswap (UNI/USD) Market Swings High to Touch a Resistance at $6
Estimated Reading Time: 3 minutes
Don’t invest unless you’re prepared to lose all the money you invest. This is a high-risk investment and you are unlikely to be protected if something goes wrong. Take 2 minutes to learn more

Free Crypto Signals Channel
Uniswap Price Prediction – July 14
The UNI/USD market swings are high to touch a resistance around the $6 trading line. There has been little force put by the market around the value line as it keeps the slightest difference between the current high and low points.
UNI/USD Market
Key Levels:
Resistance levels: $7, $8, $9
Support levels: $4, $3, $2
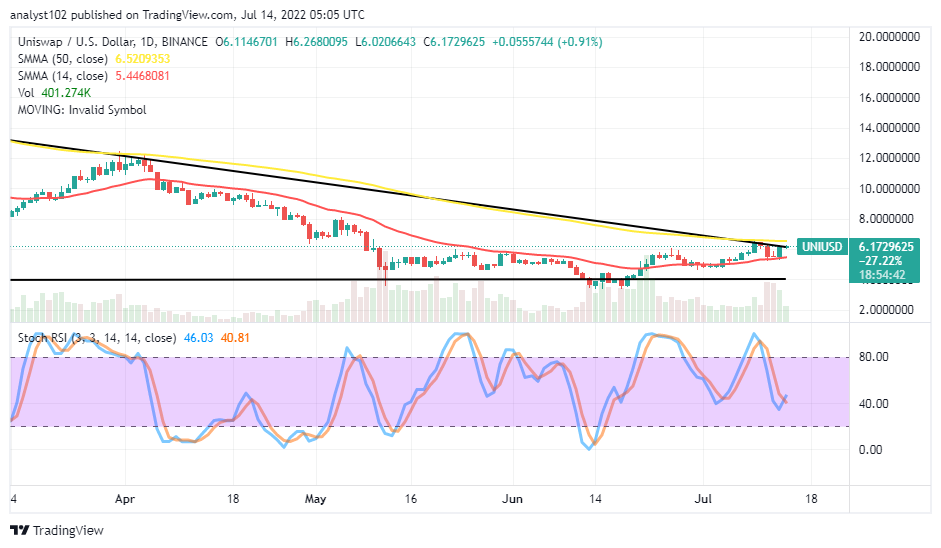
UNI/USD – Daily Chart
The UNI/USD daily chart reveals the crypto market swings high to touch a resistance around the $6 level beneath the trend line of the bigger SMA. The 14-day SMA indicator is underneath the 50-day SMA indicator. It has been that the horizontal line drawn at the $4 support level will serve against seeing the price going down than the point in the near time. The Stochastic Oscillators have crossed southbound from the overbought region down to the 40 range, trying to cross northbound to indicate the market is yet to go down from a higher spot.
Will there be more ups in the UNI/USD market as it swings high to touch resistance at $6?
There can be positions holding in the UNI/USD market operations around $6 as the crypto economy swings high to touch resistance at the value line. The set of trading candlesticks that has been piling up around the 50-day SMA trend line signifies that there can be a price convergence situation requiring a fearful breakout to nudge the crypto economy into some hikes. Meanwhile, a long-holding price around it may lead the crypto trade to another round of declining motion.
On the downside of the technical analysis, selling pressures are to take effect closely around the resistance of $7 if the UNI/USD market will have to go for an early regaining process of the market control at the expense of bulls’ possible in-active trending pressure afterward. However, another bearish candlestick underneath the 50-day SMA indicator can mean that sellers may get a selling order before a correction against the 14-day SMA from a top spot.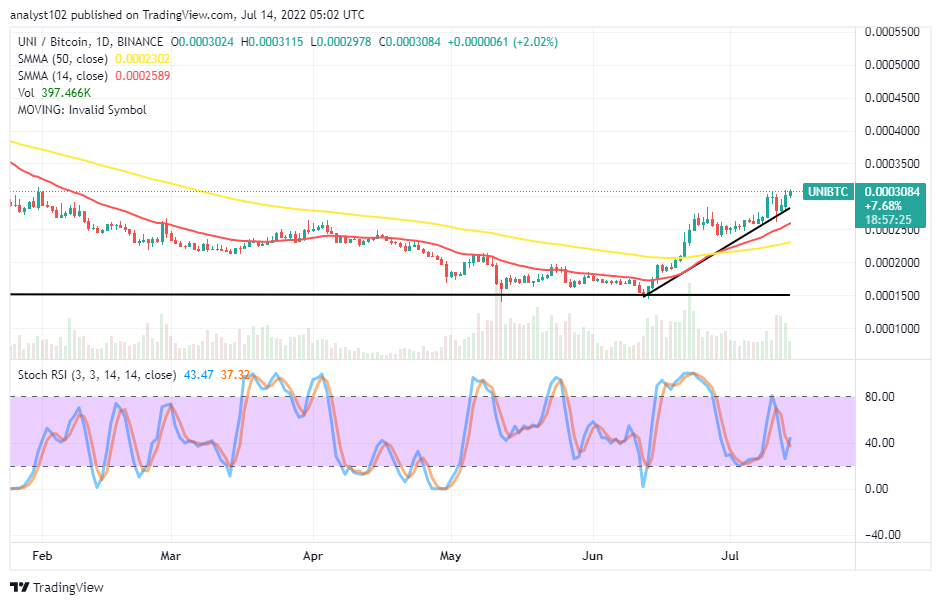
UNI/BTC Price Analysis
Uniswap’s trending force has been in an increasing-moving mode against the trending catalyst of Bitcoin in the last several days. The cryptocurrency pair price swings high to touch resistances over the trend lines of the SMAs. The 50-day SMA indicator has been intercepted from the underneath by the 14-day SMA indicator to the upside. The bullish trend line drew closely below variant candlesticks emerging in sequential order to the north direction. The Stochastic Oscillators have moved southward from the range of 80, trying to cross back northbound at the range of 40. That signifies the base crypto has a higher probability of pushing more against its counter-trading crypto.
Note: Cryptosignals.org is not a financial advisor. Do your research before investing your funds in any financial asset or presented product or event. We are not responsible for your investing results.
“Lucky is up more than 50% today but still more than 430% from All Time Highs!
The opportunity to bank BIG is now!
You can purchase Lucky Block here. Buy LBlock