Uniswap (UNI/USD) Price Frequency Remains Around $7
Estimated Reading Time: 3 minutes
Don’t invest unless you’re prepared to lose all the money you invest. This is a high-risk investment and you are unlikely to be protected if something goes wrong. Take 2 minutes to learn more
Uniswap Price Prediction – February 16
It is currently observed the UNI/USD market transactions have been witnessing some uprisings in their valuation over time above the $6 line as the crypto-economic price frequency remains around the $7 trading level to decide which path to follow afterward between $7.0196605 and $6.8076484. The percentage rate of the trading pace is at 1.50 negatives.
UNI/USD Market
Key Levels:
Resistance levels: $7.50, $8, $8.50
Support levels: $6, $5.50, $5
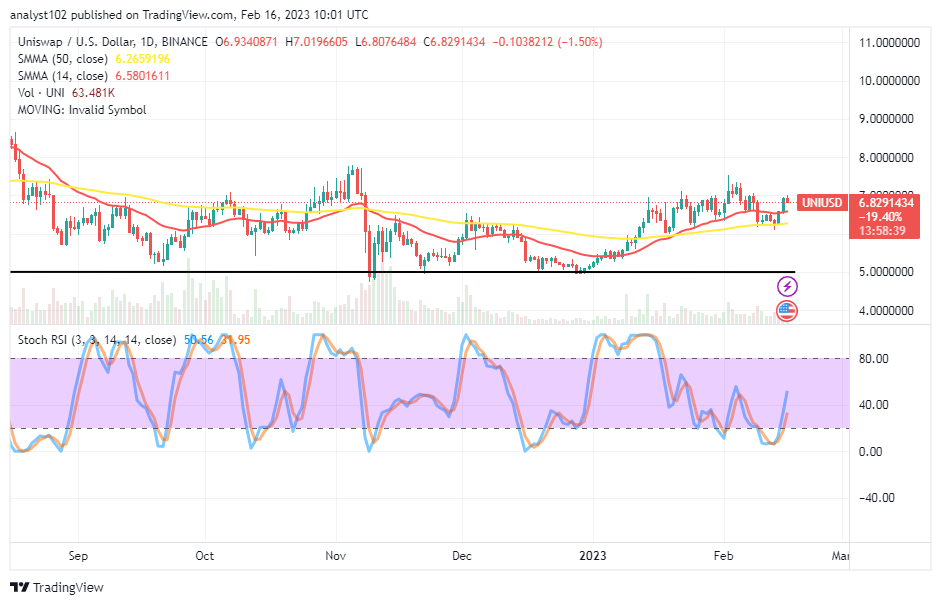
UNI/USD – Daily Chart
The UNI/USD daily chart showcases that the crypto-economic price frequency remains around $7 over the smaller SMA buy signal side. The 50-day SMA indicator is at $6.2659196 beneath the 14-day SMA indicator, which is at the $6.5801611 value line. The Stochastic Oscillators have crossed northbound from 5 levels in the oversold region to 31.95 and 50.56 points. That indicates a degree of upward velocity is ongoing to some reasonable extent.
Should buyers in the UNI/USD market be willing to leave positions to run below the $6 support level?
It would only be ethical for investors in the UNI/USD market operations to allow positions to continue to run in descending order and add to it as the crypto-economic price frequency remains around the $7 level over a couple of times. Buyers using an MT4 trading platform or similar platforms needed to apply a stop-loss order to safeguard their stance from unprecedented fall-offs.
On the decrease-moving side of the technical analysis, it may be safe for sellers to get repositioned between the $7 and the $8 levels to spot a sell entry when an active reversal motion is made at a point in time before executing a shorting order. As it is, the direction in which the Stochastic Oscillators are rising from their current levels doesn’t signify the period to go for a sell-off moment. Therefore, there is still a need to wait for a while.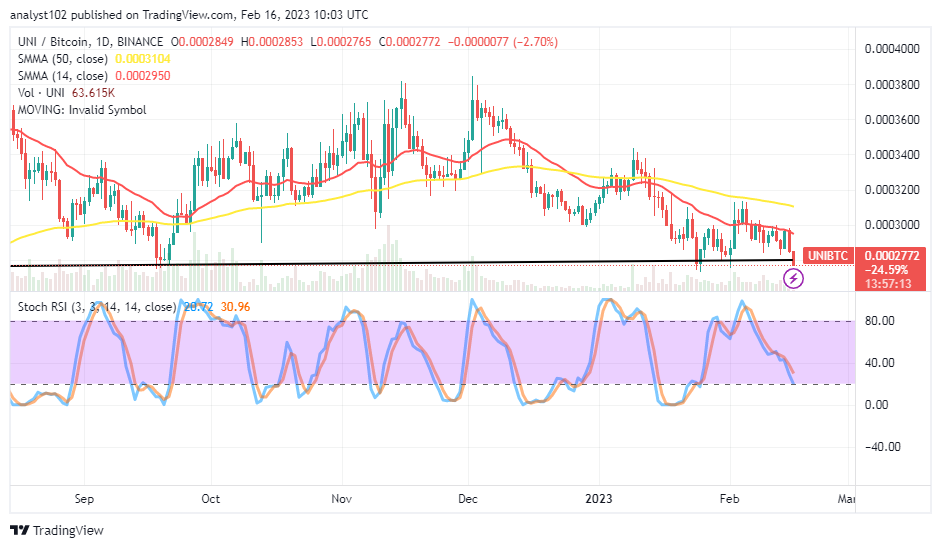
UNI/BTC Price Analysis
Uniswap’s trending ability compared with Bitcoin has been debasing relatively to some extent as the pairing crypto instrument price frequency remains lowering against its critical lower baseline below the SMAs. The 14-day SMA indicator is underneath the 50-day SMA indicator. The stochastic Oscillators have crossed southbound to 30.96 and 20.72 levels. And a bearish candlestick is in the making, showcasing the worth of the base crypto is dropping against its counter-trading crypto. Sellers need to be wary of a rebound that can necessarily resurface in no time.
Note: Cryptosignals.org is not a financial advisor. Do your research before investing your funds in any financial asset or presented product or event. We are not responsible for your investing results.
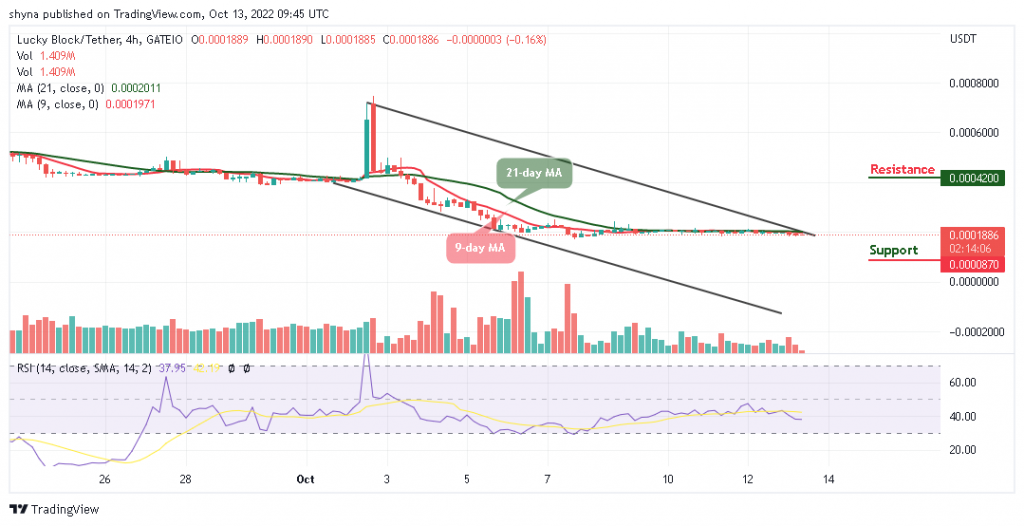
You can purchase Lucky Block here. Buy LBLOCK