Uniswap (UNI/USD) Price Keeps to a Correction
Estimated Reading Time: 3 minutes
Don’t invest unless you’re prepared to lose all the money you invest. This is a high-risk investment and you are unlikely to be protected if something goes wrong. Take 2 minutes to learn more

Free Crypto Signals Channel
Uniswap Price Prediction – July 7
The $6 resistance line has been tough against further smooth running to the upside in the UNI/USD market operations as the crypto’s price keeps to a correction underneath it. The trade has been transacting around $5 with a minimal 0.06% positive.
UNI/USD Market
Key Levels:
Resistance levels: $6, $7, $8
Support levels: $4, $3, $2
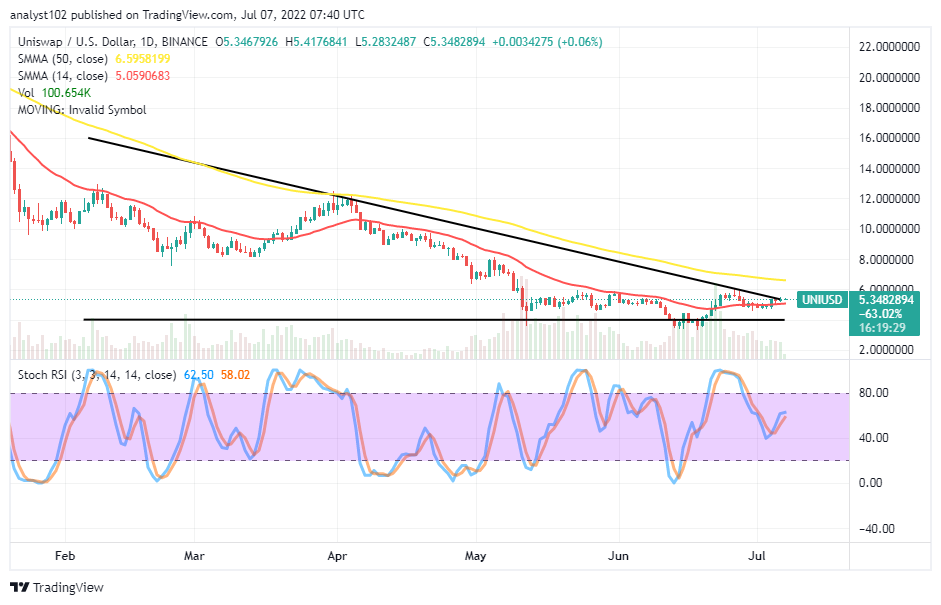
UNI/USD – Daily Chart
The UNI/USD daily chart showcases the crypto-economic price keeps to a correction underneath the bigger-SMA trend line which is a bit over the $6 resistance level. The 14-day SMA indicator is below the 50-day SMA indicator. Variant lighter-bearish candlesticks have featured closely over the smaller trading SMA, indicating a downward trending force with lesser force. The Stochastic Oscillators are seemingly trying to get repositioned at the 60 range to make a closing attempt. That signifies there may soon be a pause in the market at its current trading spot.
What is the UNI/USD trading situation like as regards getting recoveries?
The trading situation in the UNI/USD market operations portends the crypto economy won’t be probably getting stable recoveries as the price keeps to a correction under the $6 resistance level over a couple of sessions until now. Therefore, long-position traders need to exercise more patience by letting the market go down in getting a clue from a lower-range reading condition of the Stochastic Oscillators before considering launching a buying back order afterward.
On the downside of the technical analysis, the bearish path to the downside has been around the bearish trend line drawn and the space between it and the trend line of the bigger SMA indicator. The UNI/USD market bears still have the potency to push down toward the $4 support level in the wake of taking advantage of the present situation to a maximum utilization at the expense of bulls’ weaknesses so far.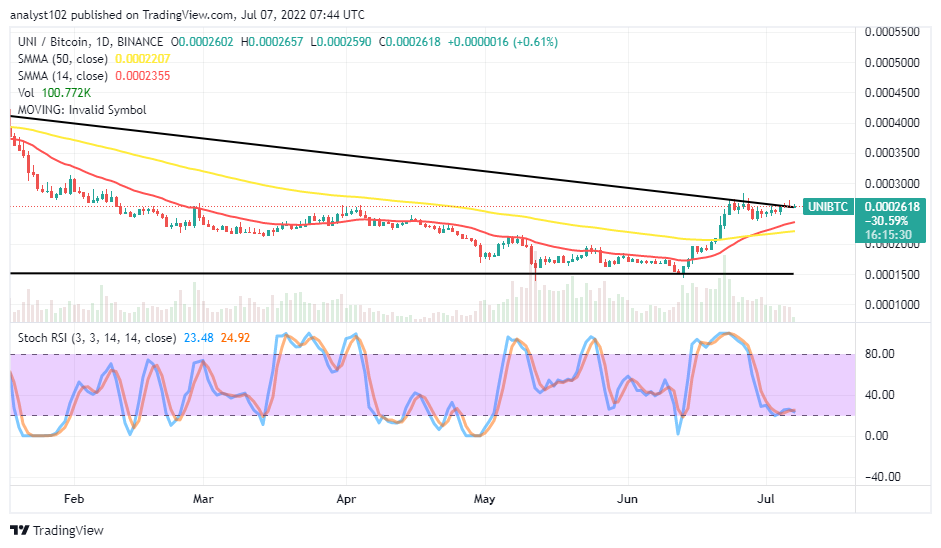
UNI/BTC Price Analysis
Uniswap, on the price analysis chart, exhibits some degrees of lower highs closely above the indicators. From another technical angle, the currency pair price keeps to a correction along the path of the bearish trend line drawn over the SMAs. The 14-day SMA indicator has intercepted the 50-day SMA indicator from underneath. The Stochastic Oscillators have moved southbound to position closely over the 20 range. And they have conjoined lines. The general verdict of the technical trading approach suggests the pairing trading cryptos tend to experience a pit stop for some time.
Note: Cryptosignals.org is not a financial advisor. Do your research before investing your funds in any financial asset or presented product or event. We are not responsible for your investing results.
“Lucky is up more than 50% today but still more than 430% from All Time Highs!
The opportunity to bank BIG is now!
You can purchase Lucky Block here. Buy LBlock